Call Detail Record - CDR: Difference between revisions
No edit summary |
|||
| Line 1: | Line 1: | ||
{{DISPLAYTITLE:User Guide: The CDR View}} | |||
CDR | '''This guide is a comprehensive tour of the main Call Detail Record (CDR) interface in the VoIPmonitor GUI. It explains every section, button, and feature, from searching for calls to analyzing their quality in detail.''' | ||
== Understanding the Main CDR View == | |||
The CDR (Call Detail Record) view is the central hub for exploring your captured call data. It is comprised of three main sections: | |||
#'''The CDR List:''' The main table displaying a paginated list of all finished calls. | |||
#'''The Button Panel:''' A toolbar for accessing key functions like filtering, charting, and exporting. | |||
#'''The Dashboard:''' A set of panels at the bottom that provide aggregated statistics for the currently displayed data. | |||
[[File:Cdr.png]] | [[File:Cdr.png|The main CDR View, showing the CDR list and the dashboard panels below.]] | ||
== The CDR List == | |||
This section details the components of the main call list, from the title bar to the information in each row. | |||
=== Title Bar & Date Filter === | |||
At the very top, the title bar displays the current time range for the calls being shown. You can click on the dates to quickly change the filter. | |||
''Note: This quick date filter can be disabled on a per-user basis in user settings.'' | |||
[[File:Cdr-titlebar.png|The title bar with a quick date range filter.]] | |||
=== Button Panel === | |||
This toolbar provides access to the most important interactive features. | |||
[[File:Cdr-list. | [[File:Cdr-buttonpanel.png|The main button panel for interacting with the CDR list.]] | ||
== | ==== 1. Filter Form ==== | ||
This is the most powerful feature for finding specific calls. Clicking this button opens a detailed search form with two main tabs. | |||
===== Common Tab ===== | |||
This tab contains filters for general call attributes and participant information. | |||
[[File:Cdr- | [[File:Cdr-filtercommon.png|The "Common" tab in the advanced filter form.]] | ||
*'''Participant Filters:''' Search by `Caller/Called Number`, `Caller/Called IP`, or `Caller/Called Domain`. You can use the `%` character as a wildcard (e.g., `222%` finds all numbers starting with 222). You can also use commas for multiple values and `!` for negation (e.g., `222%, !223%`). | |||
*'''Group Filters:''' Search by pre-defined `Caller/Called Groups` or `IP Groups`. | |||
*'''Call Attribute Filters:''' Filter by `Call Duration`, `Codec`, or `PDD` (Post-Dial Delay) ranges. | |||
*'''SIP Filters:''' Filter by `Last SIP Response Code` (e.g., `487`, or `4%` for all 4xx codes), `SIP Agent` (phone type/firmware), or `Call-ID`. | |||
*'''Other Filters:''' You can also filter by the `Sensor` that captured the call or find all `Interrupted` calls (those without a proper BYE). | |||
===== RTP Tab ===== | |||
This tab allows you to find calls based on specific Quality of Service (QoS) metrics. This is essential for troubleshooting audio quality issues. | |||
[[File:Cdr- | [[File:Cdr-rtptab.png|The "RTP" tab for filtering by quality metrics.]] | ||
*'''RTCP Metrics:''' Filter by `Jitter` or `Fraction Loss` values reported by the endpoints themselves via RTCP. | |||
*'''MOS:''' Find all calls with a Mean Opinion Score '''lower than''' a specified value. | |||
*'''PDV (Jitter):''' Find calls with a specific number of `Packet Delay Variation` events in different time intervals (e.g., find all calls with at least 10 packets delayed by more than 120ms). | |||
*'''Loss:''' Find calls based on patterns of consecutive packet loss. | |||
*'''Silence & Clipping:''' If enabled on the sensor, you can find calls with a certain percentage of silence or a specific number of clipped audio frames. | |||
==== 2. Quick Filters ==== | |||
This dropdown provides shortcuts for finding problematic calls (e.g., "Worst Calls by Loss") and gives you access to your saved filter templates. | |||
[[File:Cdr-quickfiltermenu.png|The Quick Filters menu.]] | |||
==== 3. Menu ==== | |||
This menu contains administrative actions. | |||
*'''Delete:''' Delete selected CDRs and their associated files (PCAPs, audio). | |||
*'''Export CSV:''' Export the current view of CDRs to a CSV file. | |||
[[File:Cdr-menubutton.png|The Menu button with Delete and Export options.]] | |||
[[File:Cdr- | |||
==== 4. Charts ==== | |||
This button opens a window for adding overlay charts to your current CDR view, allowing you to correlate data visually. This feature is covered in detail in the [[Charts]] guide. | |||
[[File:Cdr-chartbutton.png|The Charts button and its window.]] | |||
=== CDR List Columns === | |||
Each column in the CDR list provides key information and can be used for quick sorting. | |||
[[File:Cdr- | [[File:Cdr-columnheaders.png|An overview of the main columns in the CDR list.]] | ||
A single row represents a single call. | |||
[[File:Cdr-row.png|A single CDR row with all its columns.]] | |||
*'''ID:''' The unique identifier for the call record. | |||
*'''Sensor ID:''' The name of the sensor that captured the call. | |||
*'''Datetime:''' The start time of the call. | |||
*'''Duration (PDD) / Codec:''' Shows total call duration, Post-Dial Delay, and the audio codec used. | |||
*'''Participant Info:''' Columns for Caller/Called Number, Name, SIP IP, and SIP Agent. The small red flag ([[File:Cdrcolumnsredflag.png]]) indicates which party sent the `BYE` message first. | |||
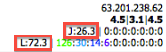
*'''Last Response:''' The final SIP response code and text for the call. | |||
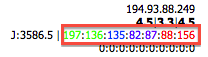
*'''RTP IP Addresses:''' The source IP addresses for the caller and callee RTP streams. | |||
*'''Quality Metrics:''' | |||
**'''MOS:''' The MOS column ([[File:Cdr-moscolumn.png]]) shows three [[Glossary#VoIPmonitor.27s_Parametric_MOS|parametric MOS scores]] based on different jitter buffer simulations (fixed 50ms, fixed 200ms, adaptive). | |||
**'''Delay:''' The Delay column ([[File:Cdr-delaycolumn.png]]) provides a color-coded distribution of packet delay variation (jitter) events. | |||
**'''Loss:''' The Loss column ([[File:Cdr-losscolumn.png]]) provides a color-coded distribution of consecutive packet loss events. | |||
**'''RTCP:''' The RTCP column ([[File:Cdr-rtcpcolumn.png]]) shows maximum jitter and fraction loss as reported by the endpoints themselves. | |||
*'''Commands:''' The Commands column ([[File:Cdr-menucolumn.png]]) contains links to download the PCAP or WAV file, and an embedded player to listen to the audio directly in the browser. | |||
== The CDR Detail View == | |||
Clicking the `[+]` icon at the beginning of any CDR row expands it to show the detailed analysis view with multiple tabs. | |||
[[File:cdr-detail.png|The expanded CDR detail view with its tabs.]] | |||
=== Summary Tab === | |||
This tab provides a detailed breakdown of call information, RTP statistics, and a full chronological log of all SIP messages for the call. | |||
[[File:Cdr-detailsummary.png|The Summary tab provides a deep dive into a single call.]] | |||
==== The Call Quality Graph ==== | |||
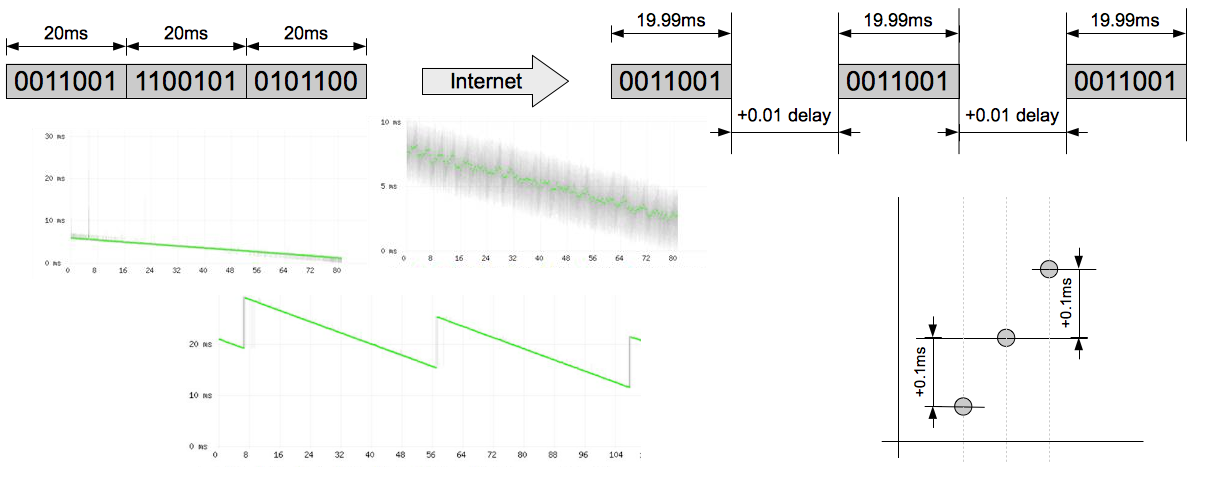
The most prominent feature is the detailed quality graph, which plots packet delay and loss over the duration of the call. | |||
[[File:cdr-graph.png|The detailed call quality graph.]] | |||
[[File: | *Each vertical line represents a group of packets. | ||
*The colored dot represents the median delay (jitter). | |||
*Packet loss is shown as red lines at the top of the graph. | |||
*'''Clock Drift:''' A graph that steadily climbs or descends ([[File:cdr-graph-drift.png]]) indicates a clock drift issue between the sending device and the sensor, not necessarily a network problem. | |||
=== SIP History Tab === | |||
This tab provides a powerful, Wireshark-like view of the call's signaling. | |||
*'''Sequence Diagram:''' A visual representation of the SIP message flow between endpoints. | |||
*'''Message Table:''' A text-based list of all SIP messages and RTP streams. | |||
*'''Packet Detail:''' Clicking on any message opens a window with a fully decoded tree view of the packet, similar to Wireshark. | |||
[[File:cdr-siphistorydiagram.png|The SIP sequence diagram.]] | |||
[[File:cdr-packetdetailtree.png|The fully decoded packet detail window.]] | |||
=== Legs by CID / Legs by Header Tabs === | |||
These tabs are used to find related call legs in complex call scenarios. | |||
*'''Legs by CID:''' Finds other calls that share the same numeric part of the `From` header tag within a few seconds of the original call. This is useful for finding the other legs of a call that was routed through a PBX. | |||
*'''Legs by Header:''' A more powerful method that correlates calls based on a shared identifier in a custom SIP header (configured by `match_header` in `voipmonitor.conf`). This is essential for tracing a single call across multiple proxies or SBCs where the Call-ID changes at each hop. | |||
=== Charts Tab === | |||
This tab displays a set of predefined and custom charts applied specifically to the context of the selected call (e.g., showing trends for the caller number). This allows for quick historical analysis without leaving the CDR view. | |||
[[File:cdr-chartstab.png|The Charts tab within the CDR detail view.]] | |||
=== Map Tab === | |||
This tab attempts to geolocate the source and destination SIP IP addresses on a world map using a GeoIP service. | |||
[[File:Cdr-map.png|The Map tab showing GeoIP locations.]] | |||
== The Dashboard Panels == | |||
The panels at the bottom of the screen provide aggregated views of the data currently displayed in the CDR list. | |||
[[File:cdr-grouppanel.png|The dashboard panels provide aggregated statistics.]] | |||
*'''Group By:''' You can group the data by `Last SIP Response`, `Codec`, `SIP IP`, or predefined `IP Groups`. | |||
*'''Charts:''' The middle section displays a pie chart of the grouped data. | |||
*'''Filters:''' Clicking on any item in the group grid (e.g., clicking on the "200 OK" response) will instantly apply it as a filter to the main CDR list above. | |||
== AI Summary for RAG == | |||
'''Summary:''' This document is a comprehensive user guide for the VoIPmonitor Call Detail Record (CDR) View, the central interface for call analysis. It provides a structured tour, starting with the main components: the CDR list, button panel, and dashboard. It details the powerful Filter Form, explaining how to search for calls using the "Common" tab (for participant info, duration, etc.) and the "RTP" tab (for quality metrics like MOS, Jitter/PDV, and Loss). The guide then breaks down the columns in the CDR list, explaining the meaning of each field, including the three types of MOS scores and the color-coded Delay and Loss distribution graphs. A significant portion is dedicated to the CDR Detail view, which is accessed by expanding a call row. It explains the Summary tab with its detailed quality graph, the Wireshark-like SIP History tab, and the "Legs by CID" and "Legs by Header" tabs used for correlating call legs in complex routing scenarios. Finally, it describes the function of the dashboard panels at the bottom for creating aggregated statistical views. | |||
'''Keywords:''' cdr, call detail record, gui, user guide, filter, search, common, rtp, qos, mos, jitter, pdv, loss, charts, graph, sip history, wireshark, sequence diagram, call legs, correlate, `match_header`, dashboard, group by | |||
'''Key Questions:''' | |||
* How do I use the main CDR view in VoIPmonitor? | |||
* How can I filter calls based on caller number, IP address, or SIP response code? | |||
* How do I search for calls with bad quality (low MOS, high jitter, or packet loss)? | |||
== | * What do the different colors and numbers in the Delay and Loss columns mean? | ||
* How do I view the detailed SIP message flow for a call? | |||
* What is the difference between "Legs by CID" and "Legs by Header"? | |||
* How can I find all related legs of a single call that crosses multiple servers? | |||
* How does the quality graph work and what does a "climbing" chart mean? | |||
* What are the dashboard panels at the bottom of the CDR view used for? | |||
''' | |||
SIP | |||
* | |||
* | |||
* | |||
CDR | |||
Latest revision as of 22:56, 30 June 2025
This guide is a comprehensive tour of the main Call Detail Record (CDR) interface in the VoIPmonitor GUI. It explains every section, button, and feature, from searching for calls to analyzing their quality in detail.
Understanding the Main CDR View
The CDR (Call Detail Record) view is the central hub for exploring your captured call data. It is comprised of three main sections:
- The CDR List: The main table displaying a paginated list of all finished calls.
- The Button Panel: A toolbar for accessing key functions like filtering, charting, and exporting.
- The Dashboard: A set of panels at the bottom that provide aggregated statistics for the currently displayed data.

The CDR List
This section details the components of the main call list, from the title bar to the information in each row.
Title Bar & Date Filter
At the very top, the title bar displays the current time range for the calls being shown. You can click on the dates to quickly change the filter. Note: This quick date filter can be disabled on a per-user basis in user settings.
![]()
Button Panel
This toolbar provides access to the most important interactive features.
![]()
1. Filter Form
This is the most powerful feature for finding specific calls. Clicking this button opens a detailed search form with two main tabs.
Common Tab
This tab contains filters for general call attributes and participant information.

- Participant Filters: Search by `Caller/Called Number`, `Caller/Called IP`, or `Caller/Called Domain`. You can use the `%` character as a wildcard (e.g., `222%` finds all numbers starting with 222). You can also use commas for multiple values and `!` for negation (e.g., `222%, !223%`).
- Group Filters: Search by pre-defined `Caller/Called Groups` or `IP Groups`.
- Call Attribute Filters: Filter by `Call Duration`, `Codec`, or `PDD` (Post-Dial Delay) ranges.
- SIP Filters: Filter by `Last SIP Response Code` (e.g., `487`, or `4%` for all 4xx codes), `SIP Agent` (phone type/firmware), or `Call-ID`.
- Other Filters: You can also filter by the `Sensor` that captured the call or find all `Interrupted` calls (those without a proper BYE).
RTP Tab
This tab allows you to find calls based on specific Quality of Service (QoS) metrics. This is essential for troubleshooting audio quality issues.

- RTCP Metrics: Filter by `Jitter` or `Fraction Loss` values reported by the endpoints themselves via RTCP.
- MOS: Find all calls with a Mean Opinion Score lower than a specified value.
- PDV (Jitter): Find calls with a specific number of `Packet Delay Variation` events in different time intervals (e.g., find all calls with at least 10 packets delayed by more than 120ms).
- Loss: Find calls based on patterns of consecutive packet loss.
- Silence & Clipping: If enabled on the sensor, you can find calls with a certain percentage of silence or a specific number of clipped audio frames.
2. Quick Filters
This dropdown provides shortcuts for finding problematic calls (e.g., "Worst Calls by Loss") and gives you access to your saved filter templates.

3. Menu
This menu contains administrative actions.
- Delete: Delete selected CDRs and their associated files (PCAPs, audio).
- Export CSV: Export the current view of CDRs to a CSV file.

4. Charts
This button opens a window for adding overlay charts to your current CDR view, allowing you to correlate data visually. This feature is covered in detail in the Charts guide.

CDR List Columns
Each column in the CDR list provides key information and can be used for quick sorting.

A single row represents a single call.

- ID: The unique identifier for the call record.
- Sensor ID: The name of the sensor that captured the call.
- Datetime: The start time of the call.
- Duration (PDD) / Codec: Shows total call duration, Post-Dial Delay, and the audio codec used.
- Participant Info: Columns for Caller/Called Number, Name, SIP IP, and SIP Agent. The small red flag (
 ) indicates which party sent the `BYE` message first.
 - Last Response: The final SIP response code and text for the call.
- RTP IP Addresses: The source IP addresses for the caller and callee RTP streams.
- Quality Metrics:
- MOS: The MOS column (
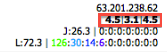 ) shows three parametric MOS scores based on different jitter buffer simulations (fixed 50ms, fixed 200ms, adaptive).
 - Delay: The Delay column (
 ) provides a color-coded distribution of packet delay variation (jitter) events.
 - Loss: The Loss column (
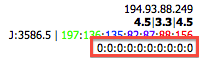 ) provides a color-coded distribution of consecutive packet loss events.
 - RTCP: The RTCP column (
 ) shows maximum jitter and fraction loss as reported by the endpoints themselves.
- MOS: The MOS column (
- Commands: The Commands column (
 ) contains links to download the PCAP or WAV file, and an embedded player to listen to the audio directly in the browser.


The CDR Detail View
Clicking the `[+]` icon at the beginning of any CDR row expands it to show the detailed analysis view with multiple tabs.

Summary Tab
This tab provides a detailed breakdown of call information, RTP statistics, and a full chronological log of all SIP messages for the call.

The Call Quality Graph
The most prominent feature is the detailed quality graph, which plots packet delay and loss over the duration of the call.

- Each vertical line represents a group of packets.
- The colored dot represents the median delay (jitter).
- Packet loss is shown as red lines at the top of the graph.
- Clock Drift: A graph that steadily climbs or descends (
 ) indicates a clock drift issue between the sending device and the sensor, not necessarily a network problem.

SIP History Tab
This tab provides a powerful, Wireshark-like view of the call's signaling.
- Sequence Diagram: A visual representation of the SIP message flow between endpoints.
- Message Table: A text-based list of all SIP messages and RTP streams.
- Packet Detail: Clicking on any message opens a window with a fully decoded tree view of the packet, similar to Wireshark.


Legs by CID / Legs by Header Tabs
These tabs are used to find related call legs in complex call scenarios.
- Legs by CID: Finds other calls that share the same numeric part of the `From` header tag within a few seconds of the original call. This is useful for finding the other legs of a call that was routed through a PBX.
- Legs by Header: A more powerful method that correlates calls based on a shared identifier in a custom SIP header (configured by `match_header` in `voipmonitor.conf`). This is essential for tracing a single call across multiple proxies or SBCs where the Call-ID changes at each hop.
Charts Tab
This tab displays a set of predefined and custom charts applied specifically to the context of the selected call (e.g., showing trends for the caller number). This allows for quick historical analysis without leaving the CDR view.

Map Tab
This tab attempts to geolocate the source and destination SIP IP addresses on a world map using a GeoIP service.

The Dashboard Panels
The panels at the bottom of the screen provide aggregated views of the data currently displayed in the CDR list.

- Group By: You can group the data by `Last SIP Response`, `Codec`, `SIP IP`, or predefined `IP Groups`.
- Charts: The middle section displays a pie chart of the grouped data.
- Filters: Clicking on any item in the group grid (e.g., clicking on the "200 OK" response) will instantly apply it as a filter to the main CDR list above.
AI Summary for RAG
Summary: This document is a comprehensive user guide for the VoIPmonitor Call Detail Record (CDR) View, the central interface for call analysis. It provides a structured tour, starting with the main components: the CDR list, button panel, and dashboard. It details the powerful Filter Form, explaining how to search for calls using the "Common" tab (for participant info, duration, etc.) and the "RTP" tab (for quality metrics like MOS, Jitter/PDV, and Loss). The guide then breaks down the columns in the CDR list, explaining the meaning of each field, including the three types of MOS scores and the color-coded Delay and Loss distribution graphs. A significant portion is dedicated to the CDR Detail view, which is accessed by expanding a call row. It explains the Summary tab with its detailed quality graph, the Wireshark-like SIP History tab, and the "Legs by CID" and "Legs by Header" tabs used for correlating call legs in complex routing scenarios. Finally, it describes the function of the dashboard panels at the bottom for creating aggregated statistical views. Keywords: cdr, call detail record, gui, user guide, filter, search, common, rtp, qos, mos, jitter, pdv, loss, charts, graph, sip history, wireshark, sequence diagram, call legs, correlate, `match_header`, dashboard, group by Key Questions:
- How do I use the main CDR view in VoIPmonitor?
- How can I filter calls based on caller number, IP address, or SIP response code?
- How do I search for calls with bad quality (low MOS, high jitter, or packet loss)?
- What do the different colors and numbers in the Delay and Loss columns mean?
- How do I view the detailed SIP message flow for a call?
- What is the difference between "Legs by CID" and "Legs by Header"?
- How can I find all related legs of a single call that crosses multiple servers?
- How does the quality graph work and what does a "climbing" chart mean?
- What are the dashboard panels at the bottom of the CDR view used for?