Scaling
Introduction
Our maximum throughput on single server (24 cores Xeon, 10Gbit NIC card) is around 20 000 calls. But VoIPmonitor can work in cluster mode where remote sensors writes to one central database with central GUI server. Usual 4 core Xeon server (E3-1220) is able to handle up to 4000 simultaneous calls and probably more.
VoIPmonitor is able to use all available CPU cores but there are several bottlenecks which you should consider before deploying and configuring VoIPmonitor. We do free full presale support in case you need help to deploy our solution.
Basically there are three types of bottlenecks - CPU, disk I/O throughput - writing pcap files and writing MySQL. The sniffer is multithreaded application but certain tasks cannot be split to more threads. Main thread is reading packets from kernel - this is the top most consuming thread and it depends on CPU type and kernel version (and number of packets per second). Below 1000 concurrent calls you do not need to be worried about CPU on usual CPU (Xeon, i5). More details about CPU bottleneck see following chapter CPU bound.
I/O bottleneck is most common problem for voipmonitor and it depends if you store to local mysql database along with storing pcap files on the same server and the same storage. See next chapter I/O throughput.
CPU bound
Reading packets
Main thread which reads packets from kernel cannot be split into more threads which limits number of concurrent calls for the whole server. CPU used for this thread is equivalent to running "tcpdump -i ethX -w /dev/null" which you can use as a test if your server is able to handle your traffic. We have tested sniffer on countless type of servers and basically the limit is somewhere around at 800Mbit for usual 1Gbit card on newer Xeon CPU and kernel versions >= 2.6.32. To get higher throughput special drivers or hardware is needed.
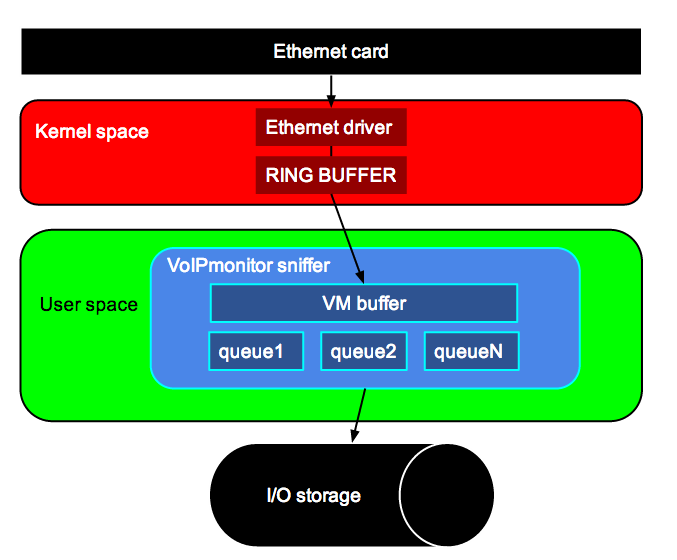
On following picture you can see how packets are proccessed from ethernet card to Kernel space to ethernet driver which queues packets to ring buffer. Ring buffer (available since kernel 2.6.32 and libpcap > 1.0) is read by libpcap library to its own voipmonitor buffer. Kernel ring buffer is circular buffer directly in kernel which reads packets from ethernet card and overwrites the oldest one if not read in time. Ring buffer can be large at maximum 2GB. VoIPmonitor sniffer reads packets from ring buffer (thread T0) and pass packets to dynamic queue allocated on heap memory which can be configured to use as much RAM as you are able to allocate which conceals packet loss when disk I/O spikes occurs.
Jitterbuffer simulater uses the most CPU and you can disable all three type of jitterbuffers if your server is not able to handle it (parameters are jitterbuffer_f1, jitterbuffer_f2, jitterbuffer_adapt). If you need to disable one of the jitterbuffer keep jitterbuffer_f2 enabled which is the most usefull.
if voipmonitor sniffer is running with at least "-v 1" you can watch several metrics:
tail -f /var/log/syslog (on debian/ubuntu)
tail -f /var/log/messages (on redhat/centos)
calls[365][401] cdrqueue[0] heap[0.1%] heapoverruns[0] comp[41.3%] traffic[25.9Mb/s] t0CPU[6.3%] t1CPU[1.6%] t2CPU[1.4%]
calls[365][405] cdrqueue[0] heap[0.0%] heapoverruns[0] comp[41.3%] traffic[25.2Mb/s] t0CPU[6.4%] t1CPU[1.6%] t2CPU[1.5%]
calls[346][386] cdrqueue[0] heap[0.1%] heapoverruns[0] comp[41.3%] traffic[25.6Mb/s] t0CPU[6.3%] t1CPU[1.6%] t2CPU[1.5%]
- calls - [X][Y] - X is actual calls in voipmonitor memory. Y is total calls in voipmonitor memory (actual + queue buffer)
- cdrqueue - is number of calls waiting to be written to MySQL. If this number is growing the MySQL is not able to handle it. See Scaling#innodb_flush_log_at_trx_commit
- heapoverruns - if this number grows the heap buffer was completely filled. In this case the primary thread will stop reading packets from ringbuffer and if the ringbuffer is full packets will be lost - this occurrence will be logged to syslog.
- comp - compression buffer ratio (if enabled)
- t0CPU - This is %CPU utilization for thread 0. Thread 0 is process reading from kernel ring buffer. Once it is over 90% it means that the current setup is hitting limit processing packets from network card. Please write to support@voipmonitor.org if you hit this limit.
- t1CPU - This is %CPU utilization for thread 1. Thread 1 is process reading packets from thread 0, adding it to the buffer and compress it (if enabled).
- t2CPU - This is %CPU utilization for thread 2. Thread 2 is process which parses all SIP packets. If >90% there the sensor is hitting limit - please contact support@voipmonitor.org if you see >90%.
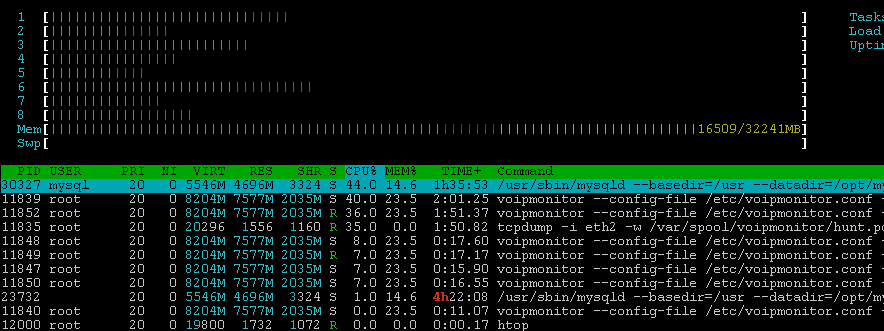
Good tool for measuring CPU is http://htop.sourceforge.net/
Software driver alternatives
If your traffic is to much for your current hardware you can try PF_RING feature.
- PF_RING http://www.ntop.org/products/pf_ring/
- Direct NIC Access http://www.ntop.org/products/pf_ring/dna/
We tried DNA driver for stock 1Gbit Intel card which reduces 100% CPU load to 20%.
Hardware NIC cards
We have succesfully tested 1Gbit and 10Gbit cards from Napatech which delivers packets to voipmonitor at 0% CPU.
I/O bottleneck
For storing up to 100 simultaneous calls (with all SIP and RTP packets saving) you do not need to be worried about I/O performance much. For storing up to 500 calls your disk must have enabled write cache (some raid controllers are not set well for random write scenarios or has write cache disabled at all). For up to 1000 calls you can use ordinary SATA 7.2kRPM disks with NCQ enabled - like Western digital RE4 edition (RE4 is important as it implements good NCQ) and we use it for installations for saving full SIP+RTP up to 1000 simultaneous calls. If you have more than 1000 simultaneous calls you can still use usual SATA disk but using cachedir feature (see below) or you need to look for some hardware raid and test the performance before you buy! Performance of such raids varies a lot and there is no general recommendation or working solutions which we can provide as a reference.
SSD disks are not recommended for pcap storing because of its low durability.
VoIPmonitor sniffer produces the worst case scenario for spin disks - random write. The situation gets worse in case of ext3/ext4 file systems which uses journal and writes meta data enabled by default thus adding more I/O writes. But ext4 can be tweaked to get maximum performance disabling journal and some other tweaks in cost of readability in case of system crash. We are recommending to use dedicated disk and format it with special ext4 switches. If you cannot use dedicated disk for storing pcap files use dedicated partition formatted with special tweaks (see below).
The fastest filesystem for voipmonitor spool directory is EXT4 with following tweaks. Assuming your partition is /dev/sda2:
mke2fs -t ext4 -O ^has_journal /dev/sda2
tune2fs -O ^has_journal /dev/sda2
tune2fs -o journal_data_writeback /dev/sda2
#add following line to /etc/fstab
/dev/sda2       /var/spool/voipmonitor  ext4    errors=remount-ro,noatime,nodiratime,data=writeback,barrier=0 0 0
In case your disk is still not able to handle traffic you can enable cachedir feature (voipmonitor.conf:cachedir) which stores all files into fast storage which can handle random write - for example RAM disk located at /dev/shm (every linux distribution have enabled this for up to 50% of memory). After the file is closed (call ends) voipmonitor automatically move the file from this storage to spooldir directory which is located on slower storage in guaranteed serial order which eliminates random write problem. This also allows to use network shares which is usually too slow to use it for writing directly to it by voipmonitor sniffer.
MySQL performance
Write performance
Write performance depends a lot if a storage is also used for pcap storing (thus sharing I/O with voipmonitor) and on how mysql handles writes (innodb_flush_log_at_trx_commit parameter - see below). Since sniffer version 6 MySQL tables uses compression which doubles write and read performance almost with no trade cost on CPU.
innodb_flush_log_at_trx_commit
Default value of 1 will mean each update transaction commit (or each statement outside of transaction) will need to flush log to the disk which is rather expensive, especially if you do not have Battery backed up cache. Many applications are OK with value 2 which means do not flush log to the disk but only flush it to OS cache. The log is still flushed to the disk each second so you normally would not loose more than 1-2 sec worth of updates. Value 0 is a bit faster but is a bit less secure as you can lose transactions even in case MySQL Server crashes. Value 2 only cause data loss with full OS crash. If you are importing or altering cdr table it is strongly recommended to set temporarily innodb_flush_log_at_trx_commit = 0 and turn off binlog if you are importing CDR via inserts.
innodb_flush_log_at_trx_commit = 2
compression
MySQL 5.1
set in my.cf in [global] section this value:
innodb_file_per_table = 1
MySQL > 5.1
MySQL> set global innodb_file_per_table = 1;
MySQL> set global innodb_file_format = barracuda;
Tune KEY_BLOCK_SIZE
If you choose KEY_BLOCK_SIZE=2 instead of 8 the compression will be twice better but with CPU penalty on read. We have tested differences between no compression, 8kb and 2kb block size compression on 700 000 CDR with this result (on single core system – we do not know how it behaves on multi core systems). Testing query is select with group by.
No compression – 1.6 seconds
8kb 	-  1.7 seconds
4kb 	- 8 seconds
Read performance
Read performance depends how big the database is and how fast disk operates and how much memory is allocated for innodb cache. Since sniffer version 7 all large tables uses partitioning by days which reduces needs to allocate very large cache to get good performance for the GUI. Partitioning works since MySQL 5.1 and is highly recommended. It also allows instantly removes old data by wiping partition instead of DELETE rows which can take hours on very large tables (millions of rows).
innodb_buffer_pool_size
This is very important variable to tune if you’re using Innodb tables. Innodb tables are much more sensitive to buffer size compared to MyISAM. MyISAM may work kind of OK with default key_buffer_size even with large data set but it will crawl with default innodb_buffer_pool_size. Also Innodb buffer pool caches both data and index pages so you do not need to leave space for OS cache so values up to 70-80% of memory often make sense for Innodb only installations.
We recommend to set this value to 50% of your available RAM. 2GB at least, 8GB is optimal. All depends how many CDR do you have per day.
innodb_buffer_pool_size = 8GB
Partitioning
Partitioning is enabled by default since version 7. If you want to take benefit of it you need to start with clean database - there is no conversion procedure from old database to partitioned one. Just create new database and start voipmonitor with new database and partitioning will be created. You can turn off partitioning by setting cdr_partition = no in voipmonitor.conf

