Difference between revisions of "Call Detail Record - CDR"
| Line 164: | Line 164: | ||
The first table shows SIP signalization information like call start, duration, PDD time, ringing time and connected time, last SIP reposne, caller and called information. Under this table bigger WAV player is shown. The next table shows RTP statistics, PDV intervals and loss intervals. Avg compressed jitter represents PDV where number 1 is no jitter (or very little). A higher number represents higher jitter. Max compressed jitter shows the maximum jitter during the call. This value is computed according to RTP RFC. | The first table shows SIP signalization information like call start, duration, PDD time, ringing time and connected time, last SIP reposne, caller and called information. Under this table bigger WAV player is shown. The next table shows RTP statistics, PDV intervals and loss intervals. Avg compressed jitter represents PDV where number 1 is no jitter (or very little). A higher number represents higher jitter. Max compressed jitter shows the maximum jitter during the call. This value is computed according to RTP RFC. | ||
| − | The last table Shows SIP messages chronologically. Each SIP message, when clicked, will display a new WINDOWwith full packet information with all protocols Ethernet – IP – UDP – SIP/RTP. | + | The last table Shows SIP messages chronologically. Each SIP message, when clicked, will display a new WINDOWwith full packet information with all protocols Ethernet – IP – UDP – SIP/RTP. |
| + | |||
| + | ==== Graph ==== | ||
| + | |||
| + | The graph section shows detailed delay and loss distribution. Clicking on the graph will open new window with the graph. | ||
| + | |||
| + | [[File:cdr-graph.png]] | ||
| + | |||
| + | - Each vertical tick represents 20 received packets- The colored dot represents PDV median from 20 received packets - Gray lines represents PDV variation, max and low values. If helps optically how the PDV spreads over the call. - Color of a dot represents packet loss. The legend is below the graph. Green dot is 0% packet loss. Red dots mean more than 19 packets are lost. | ||
=== SIP:history === | === SIP:history === | ||
Revision as of 15:38, 10 May 2013
CDR
CDR shows all saved and finished calls in the database cdr table. The CDR main window is divided to the CDR list and Dashboard at the bottom. Dashboard can be resize or hiden.

CDR list window

Title bar
CDR list starts with Title bar where the usercan quickly filter calls based on date range. (please note that this date range will not be active if you disabled it in user preferences).
![]()
Button panel
Below the CDR title is the button panel where you can list through CDR pages and access filters and other features
![]()
Filter Form button
clicking on Filter Form button shows an advanced Search form with two tabs on top - “common” and “RTP”. All search parameters can be saved as a template for repetitive usage which you can find under the quick filters button.
Common tab

- Date range filters CDR based on Date and/or Hour/Minute criteria.
- Caller called number or name or domain can be filtered for a specific number/string or for specific prefix “222%” or specific suffix “%222”. (please note that searching for a suffix uses reversed column with the index and is as fast as searching for a prefix). You can also search only for the caller or only for the called number clicking on the arrow and selecting Caller num. You can also combine searching by “,” and use negation – 222%, 223%, !2232% - this example means search calls starting with 222 or 223 but not starting with 2232.

- Caller or called group can be used for searching for specific list of numbers. You can manage groups directly by clicking on the group icon.
- Caller or Called domain searches CDR by @domain. The domain is taken from "From" SIP header.
- Caller name searches by caller name part
- Caller or Called IP – use single IP address or specific network like 192.168.0.0/24. CDR is filtered by SIP IP signalization.
- Caller or Called IP group can be used for searching for specific list of IP. You can manage groups directly by clicking on the group icon.
- Codec searches calls by specific codecs where you can select multiple codecs.
- Call duration filters by specific duration interval (total call length including ringing).
- PDD - filters by Post Dial Delay range.
- Last SIP response code filters by SIP status codes (like 483, 503, 603 etc). To find all 4XX responses use 4% syntax.
- Direction (by trunk) – filters calls by direction IN, OUT or Internal. To define the direction you need to create an IP group and set a trunk check box on it.
- Internal calls are all which does not match the IP list of all Trunk IP groups.
- Interrupted call - check box finds all interrupted calls which are those without BYE or confirmation to BYE.
- SIP agent - filters SIP agent header. This header usually carries phone manufacturer/firmware version.
- RTP source IP – filters calls by RTP source IP addresses instead of SIP IP addresses.
- Call ID filters SIP Call-ID header which is a unique string. This string also names pcap files.
- Sensor - you can filter CDR by specific sensor
RTP tab
RTP tab is used to filter calls by RTP metrics.

- RTCP Jitter – filters calls by the worst RTCP jitter value of both directions either by its MAX value or average value.
- RTCP fraction loss – filters calls by the worst RTCP fraction loss value of both directions either by its MAX value or average value.
- MOS – filters all calls which have MOS lower than entered value.
- Delay – Search calls by PDV intervals. To find the worst calls use PDV intervals >120 for at least 10 occurrences.
- Loss – Search calls by number of consecutive loss. Number 1 represents the number of single packet occurrences, number 2 is the number of times two consecutive packets have been lost, ..., number 10 is the number of times more than 10 consecutive packets have been lost.
Quick filters button
used to find the worst calls by Loss, Delay or combination of that two (MOS). Here is also saved filter form templates (at the bottom of menu. If no filter templates exists there is no items in this menu).

Order current data will order the current filtered CDR by Loss, Delay or MOS score. Last 24 hours, 7 days, 30 days and year will order by worst Loss, Delay or MOS score. Keep in mind that ordering millions of CDR (month or year) can take a lot of time.
Reset filter button
This button resets search criteria to default values.
Menu button
Under the Menu button areDelete and Export CSV. Delete allows the user to delete CDR records and files either for all current filtered CDRs or only for selected filters (you can select several CDR by holding CTRL+mouse click).

Charts button
Activates small window with charts which is used to add charts to current data. Charts are described in detail in chapter Charts.

- Undock button detaches chart window to float window
- Close button hides charts window
- Add chart button shows a chart form for adding graph
Right upper corner icons
- Saves graph as SVG or as PDF*Modifies created graph
- Creates new internal ticket with chart image*Removes graph
CDR column headers
Column headers contains quick filters and some are sortable. Some of the columns may be hidden or reordered by dragging it.

CDR row

The CDR row contains these columns
- ID – Each CDR is assigned a new, unique, consecutive number.
- sensor id - name of sensor which created the CDR. It can be blank (if id_sensor is not set in sniffer)
- Datetime – is start of the call
- Duration (PDD)/Codec – shows Duration of call, PDD and codec used.
- Call num/name, SIP source IP, SIP agent shows information identifying caller.
- Called num, SIP destination IP, SIP agent shows information identifying callee.
- Last response – shows number and full text of the last SIP response. For connected calls it shows 200 OK.
- Column Caller/Called RTP shows the source IP address of Caller/Called RTP stream. The IP address represents SOURCE IP of Caller or Called RTP stream.
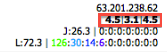 MOS Score row shows MOS score for three type of jitterbuffer – fixed 50, fixed 200 and adaptive 500.
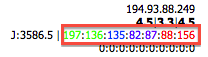 Delay distribution shows all PDV intervals colored accordingly. Left number is 50 – 70ms interval and has green color. The most right number is PDV interval >300ms and has red color.
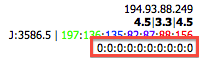 Loss distribution shows all loss intervals colored accordingly. The green number on the left represents occurrences of one consecutive loss. The red number on the right represents occurrences of more than ten consecutive losses.
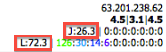 RTCP part (if RTCP packet was captured) shows MAX RTP jitter (J:26.3) and MAX RTCP fraction loss (L:72.3). RTCP in Caller column shows how called side sees the stream.
 Commands shows two links and one flash-based WAV player. PCAP will download PCAP file and WAV link will download audio file.Play button starts playing directly in web browser (the flash plugin must be installed).


CDR detail
Clicking on [+] shows the full details of the CDR with extended information.

The detail area starts with tabs – the first one is a summary, next is SIP: history followed by Legs by CID and Legs by header.
Summary

The first table shows SIP signalization information like call start, duration, PDD time, ringing time and connected time, last SIP reposne, caller and called information. Under this table bigger WAV player is shown. The next table shows RTP statistics, PDV intervals and loss intervals. Avg compressed jitter represents PDV where number 1 is no jitter (or very little). A higher number represents higher jitter. Max compressed jitter shows the maximum jitter during the call. This value is computed according to RTP RFC.
The last table Shows SIP messages chronologically. Each SIP message, when clicked, will display a new WINDOWwith full packet information with all protocols Ethernet – IP – UDP – SIP/RTP.
Graph
The graph section shows detailed delay and loss distribution. Clicking on the graph will open new window with the graph.

- Each vertical tick represents 20 received packets- The colored dot represents PDV median from 20 received packets - Gray lines represents PDV variation, max and low values. If helps optically how the PDV spreads over the call. - Color of a dot represents packet loss. The legend is below the graph. Green dot is 0% packet loss. Red dots mean more than 19 packets are lost.
SIP:history
SIP history tab shows SIP packets chronologically.
button bar
![]()
- Undock will detach SIP history panel to standalone window
- wireshark filter is display filter according to wireshark specification. You can filter out some messages etc.
- download pcap will download pcap file filtered with wireshark filter (if set)
diagram

Diagram shows chronologically SIP messages and RTP streams. Clicking on SIP or RTP stream shows detail packet window
messages

SIP messages shows chronologically SIP messages and RTP streams in text table. Clicking on SIP or RTP magnifier shows detail packet window.
Packet detail window
Packet detail window shows SIP messages in wireshark mode or RAW text mode. In wireshark mode you can click on Expand All or Expand SIP branch button which will expand wireshark mode branches.
![]()

