Scaling
Scaling
VoIPmonitor is able to use all available CPU cores but there are several bottlenecks which you should consider before deploying and configuring VoIPmonitor.
Basically there are two types of bottlenecks - CPU and I/O throughput. Sniffer is multithreaded application but certain tasks cannot be split to more threads. Main thread is reading packets from kernel - this is the top most consuming thread and it depends on CPU type and kernel version (and number of packets per second). Below 1000 concurrent calls you do not need to be worried about CPU on usual CPU (Xeon, i5). More details about CPU bottleneck see following chapter CPU bound.
I/O bottleneck is most common problem for voipmonitor and it depends if you store to local mysql database along with storing pcap files on the same server and the same storage. Differences between I/O hardware and file system are so significant that there is no general recommendation and the problem can be for 100 concurrent calls. See next chapter I/O throughput.
CPU bound
Reading packets
Main thread which reads packets from kernel cannot be split into more threads which limits number of concurrent calls for the whole server. Consumed CPU for this thread is equivalent to running "tcpdump -i ethX -w /dev/null" which you can use as a test if your server is able to handle your traffic. We have tested sniffer on countless type of servers and basically the limit is somewhere around at 800Mbit for usual 1Gbit card on newer Xeon CPU and kernel versions >= 2.6.32. To get higher throughput special drivers or hardware is needed.
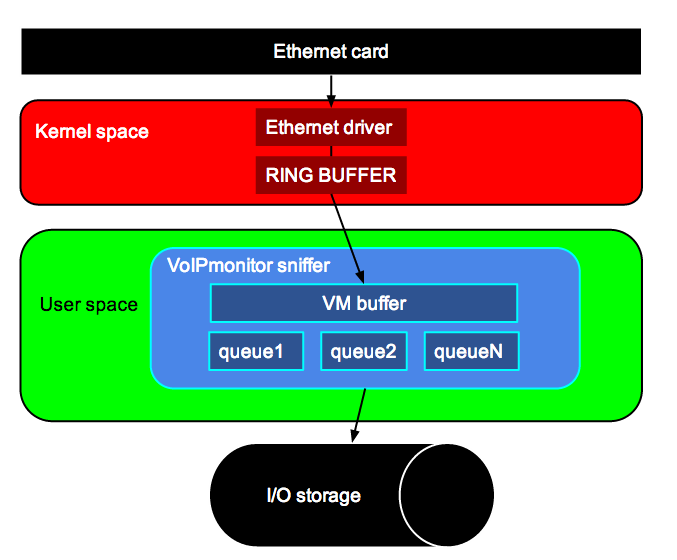
On this picture you can see how packets are proccessed from ethernet card to Kernel space ethernet driver which queues packets to ring buffer. Ring buffer (available since kernel 2.6.32 and libpcap > 1.0) is read by libpcap functions in voipmonitor to its own voipmonitor buffer. Kernel ring buffer is circular buffer directly in kernel which reads packets and overwrites the oldest one if not read in time. Ring buffer can be large at maximum 2GB. If voipmonitor is blocked by CPU or I/O the ring buffer starts filling up to its maximum set size (voipmonitor.conf:ringbuffer=XXX) and in this case dropping packets occurs which is logged into the syslog. VoIPmonitor sniffer reads packets from ring buffer in one main thread and writing packets to voipmonitor buffer with maximum size 4GB (voipmonitor.conf:vmbuffer=XXXX). Which means that maximum buffer size is 6GB RAM which can cover I/O low throughput cases until all the buffer is filled. Thus if you set both buffers to its maximum values and your I/O is not able to handle save all packets to disk (if saving is enabled) you can see dropping packets after 6GB of packets fills buffers. VoIPmonitor buffer is read by another thread to one or more queues which depends on how much CPU is available (voipmonitor.conf:rtpthreads=X). Those queues processes RTP packets in parallel. Jitterbuffer simulater uses the most CPU and you can disable all three type of jitterbuffers if your server is not able to handle it all (jitterbuffer_f1, jitterbuffer_f2, jitterbuffer_adapt). If you need to disable one of the jitterbuffer keep jitterbuffer_f2 enabled which is the most usefull.
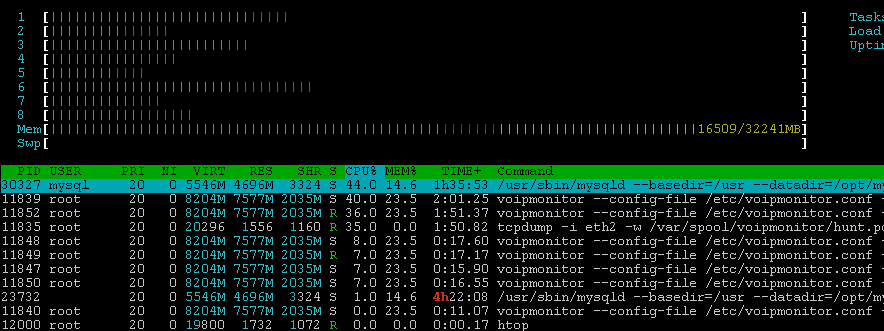
Good tool for measuring CPU is http://htop.sourceforge.net/
Software driver alternatives
If your traffic is to much for your current hardware you can try PF_RING feature.
- PF_RING http://www.ntop.org/products/pf_ring/
- Direct NIC Access http://www.ntop.org/products/pf_ring/dna/
We tried DNA driver for stock 1Gbit Intel card which reduces 100% CPU load to 20% but we still saw occasional packet loss on the card - although the loss was minimal.
Hardware NIC cards
We have tested 10Gbit cards from Napatech which can handle at least 20000 concurrent calls with 0% CPU for main thread. Those cards are very expensive but the performance is worth it.
The top most consuming CPU is first thread which reads packets from kernel. If you have very large traffic above ~500 Mbit you should check if the first thread is not droping packets by checking syslog where the sniffer is reporting any drop occurences. If you have much more traffic and the CPU is not able to handle, you can use special kernel modules and drivers which supports hardware acceleration for sniffing very large traffic – but this is only case when your traffic is very large (~5000 simulatenouse calls) Second top most consuming CPU is threads processing jitterbuffer simulator. In case you do not have enough CPU cores (one or two only) you can turn off jitterbuffer simulator in configuration and keep enabled only one (f2) or turn it off completely. If you have enough CPU cores (at least 4) you should not worry about CPU.

