Charts are used to plot various data sources like number of concurrent calls or quality of calls over time. Data sources can be combined to one chart allowing the viewer to see the correlation of desired data sources like SIP 4XX/5XX responses on ASR. The graph itself is interactive – clicking on a particular legend hides the datasource. Hovering on a datasource highlights it and shows the local value.
Charts are used to plot various data sources like number of concurrent calls or quality of calls over time. Data sources can be combined to one chart allowing the viewer to see the correlation of desired data sources like SIP 4XX/5XX responses on ASR. The graph itself is interactive – clicking on a particular legend hides the datasource. Hovering on a datasource highlights it and shows the local value.
Charts are also present in the CDR window in the right mini-window sharing the same functionality with only difference that in CDR section the graph takes data from the current filter.
Charts are also present in the CDR window in the right mini-window sharing the same functionality with only difference that in CDR section the graph takes data from the current filter.
== Add chart ==
== Add chart ==
Line 13:
Line 13:
== Chart configuration ==
== Chart configuration ==
Chart configuration contains three tabs at the top – base chart data, filters – common and filters – rtp. The filters tab is used to filter data sources by various criteria – for detailed description please refer to CDR chapter.
Chart configuration contains three tabs at the top – base chart data, filters – common and filters – rtp. The filters tab is used to filter data sources by various criteria – for detailed description please refer to CDR chapter.
[[File:charts-threetabs.png]]
[[File:charts-threetabs.png]]
The chart configuration panel is divided to three sections. Date range, series and description.
The chart configuration panel is divided to three sections. Date range, series and description.
Line 22:
Line 22:
=== Templates ===
=== Templates ===
Line 28:
Line 28:
template field contains predefined chart configurations and custom templates which you can create / modify. To create new template - write name of it to description title field which shows save template button next to templates combo box.
template field contains predefined chart configurations and custom templates which you can create / modify. To create new template - write name of it to description title field which shows save template button next to templates combo box.
Line 36:
Line 36:
[[File:charts-daterange.png]]
[[File:charts-daterange.png]]
* Time interval
* Time interval
[[File:charts-timeinterval.png]]
[[File:charts-timeinterval.png]]
* Time axes is density on the X axis.
* Time axes is density on the X axis.
[[File:charts-density.png]]
[[File:charts-density.png]]
=== series ===
=== series ===
Series section contains data sources for the charts.
Series section contains data sources for the charts.
[[File:charts-seriessection.png]]
[[File:charts-seriessection.png]]
Line 51:
Line 51:
==== series column ====
==== series column ====
Series column chooses which data source will be plotted.
Series column chooses which data source will be plotted.
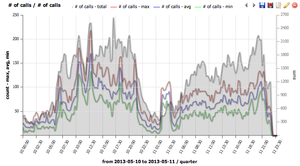
*number of calls shows min/max/avg simultaneous calls distribution and total calls distribution [[File:charts-templatenumberofcalls.png|thumbnail]]*MOS / jitter / delay / packet loss shows RTP statistics *RTCP shows RTCP protocol values*ACD, ASR, PDD, SIP responses shows signalization related values*codecs shows codec distribution
*number of calls shows min/max/avg simultaneous calls distribution and total calls distribution [[File:charts-templatenumberofcalls.png|thumbnail]]*MOS / jitter / delay / packet loss shows RTP statistics *RTCP shows RTCP protocol values*ACD, ASR, PDD, SIP responses shows signalization related values*codecs shows codec distribution*CallPerSec shows Calls Per Second (CPS) rate over time - use the CallPerSec template for quick CPS visualization
* ACD average shows averaged call duration for all calls which started in the given interval.
* ACD average shows averaged call duration for all calls which started in the given interval.
* ACD immediate shows averaged call duration for all calls which are ongoing in the given interval. Thus this chart will show higher ACD for short intervals.
* ACD immediate shows averaged call duration for all calls which are ongoing in the given interval. Thus this chart will show higher ACD for short intervals.
[[File:charts-seriescolumn.png]]
[[File:charts-seriescolumn.png]]
Line 63:
Line 63:
==== param ====
==== param ====
Param column specifies SIP response code
Param column specifies SIP response code
[[File:charts-paramcolumn.png]]
[[File:charts-paramcolumn.png]]
Line 71:
Line 71:
Axis side is used to assign data source to the left Y axis or to the right Y axis.
Axis side is used to assign data source to the left Y axis or to the right Y axis.
Line 78:
Line 78:
==== primary ====
==== primary ====
Primary checkbox is used in case where more datasources are drawn on left or right Y. The primary checked datasource fills the whole Y axe and non-primary datasources use that scale. Here is example:
Primary checkbox is used in case where more datasources are drawn on left or right Y. The primary checked datasource fills the whole Y axe and non-primary datasources use that scale. Here is example:
[[File:charts-primarycolumn.png]]
[[File:charts-primarycolumn.png]]
Line 103:
Line 103:
*Fill fills area below the line type chart
*Fill fills area below the line type chart
*Markers plot dots at line
*Markers plot dots at line
*Smooth draw smoothes line instead of straight lines between points
*Smooth draw smoothes line instead of straight lines between points
Line 114:
Line 114:
[[File:charts-description.png]]
[[File:charts-description.png]]
Setting your own title will allow to save a created graph for repetitive use. Once the title is filled or changed, the save button will appear next to type chart.
Setting your own title will allow to save a created graph for repetitive use. Once the title is filled or changed, the save button will appear next to type chart.
[[File:charts-savetemplate.png]]
[[File:charts-savetemplate.png]]
Line 120:
Line 120:
== Filters - common ==
== Filters - common ==
Filters CDR data in the same way as CDR filter formular except date range which is in the first base chart data section.
Filters CDR data in the same way as CDR filter formular except date range which is in the first base chart data section.
[[File:charts-filters-common.png]]
[[File:charts-filters-common.png]]
Line 126:
Line 126:
== Filters - RTP ==
== Filters - RTP ==
Filters CDR data in the same way as CDR filter formular
Filters CDR data in the same way as CDR filter formular
[[File:charts-filters-rtp.png]]
[[File:charts-filters-rtp.png]]
== AI Summary for RAG ==
'''Summary:''' Charts in VoIPmonitor visualize call data over time with interactive graphs. Create charts by clicking + and configuring date range, series (data sources), and description. Available data sources include number of calls, MOS/jitter/delay/packet loss, RTCP values, ACD/ASR/PDD/SIP responses, codecs, and CallPerSec for calls per second metrics. Templates provide quick chart configurations. Filters (common and RTP) can be applied to CDR data same as CDR filter forms.
'''Keywords:''' charts, graphs, visualization, number of calls, CallPerSec, CPS, calls per second, MOS, jitter, delay, packet loss, RTCP, ACD, ASR, PDD, codecs, templates, filters
Revision as of 01:51, 5 January 2026
Charts
Charts are used to plot various data sources like number of concurrent calls or quality of calls over time. Data sources can be combined to one chart allowing the viewer to see the correlation of desired data sources like SIP 4XX/5XX responses on ASR. The graph itself is interactive – clicking on a particular legend hides the datasource. Hovering on a datasource highlights it and shows the local value.
Charts are also present in the CDR window in the right mini-window sharing the same functionality with only difference that in CDR section the graph takes data from the current filter.
Add chart
To create new graph click on the + button.
Chart configuration
Chart configuration contains three tabs at the top – base chart data, filters – common and filters – rtp. The filters tab is used to filter data sources by various criteria – for detailed description please refer to CDR chapter.
The chart configuration panel is divided to three sections. Date range, series and description.
Templates
template field contains predefined chart configurations and custom templates which you can create / modify. To create new template - write name of it to description title field which shows save template button next to templates combo box.
Date range
Time interval
Time axes is density on the X axis.
series
Series section contains data sources for the charts.
series column
Series column chooses which data source will be plotted.
number of calls shows min/max/avg simultaneous calls distribution and total calls distribution *MOS / jitter / delay / packet loss shows RTP statistics *RTCP shows RTCP protocol values*ACD, ASR, PDD, SIP responses shows signalization related values*codecs shows codec distribution*CallPerSec shows Calls Per Second (CPS) rate over time - use the CallPerSec template for quick CPS visualization
ACD average shows averaged call duration for all calls which started in the given interval.
ACD immediate shows averaged call duration for all calls which are ongoing in the given interval. Thus this chart will show higher ACD for short intervals.
param
Param column specifies SIP response code
axis side
Axis side is used to assign data source to the left Y axis or to the right Y axis.
primary
Primary checkbox is used in case where more datasources are drawn on left or right Y. The primary checked datasource fills the whole Y axe and non-primary datasources use that scale. Here is example:
type
Type of graph
Line
Decoration for line type chart
Color
Color of chart
Fill / Markers / Smooth
Fill fills area below the line type chart
Markers plot dots at line
Smooth draw smoothes line instead of straight lines between points
Description
Description names graph, axis and sets legend position (top/left/right/bottom or no legend).
Setting your own title will allow to save a created graph for repetitive use. Once the title is filled or changed, the save button will appear next to type chart.
Filters - common
Filters CDR data in the same way as CDR filter formular except date range which is in the first base chart data section.
Filters - RTP
Filters CDR data in the same way as CDR filter formular
AI Summary for RAG
Summary: Charts in VoIPmonitor visualize call data over time with interactive graphs. Create charts by clicking + and configuring date range, series (data sources), and description. Available data sources include number of calls, MOS/jitter/delay/packet loss, RTCP values, ACD/ASR/PDD/SIP responses, codecs, and CallPerSec for calls per second metrics. Templates provide quick chart configurations. Filters (common and RTP) can be applied to CDR data same as CDR filter forms.
Keywords: charts, graphs, visualization, number of calls, CallPerSec, CPS, calls per second, MOS, jitter, delay, packet loss, RTCP, ACD, ASR, PDD, codecs, templates, filters