Order of GeoIP processing: Difference between revisions
(Add documentation on manually updating GeoIP database by copying tables from another system) |
(Review: improved formatting, structure, code syntax highlighting, added Category tag) |
||
| Line 1: | Line 1: | ||
= | [[Category:Configuration]] | ||
= Dashboard = | |||
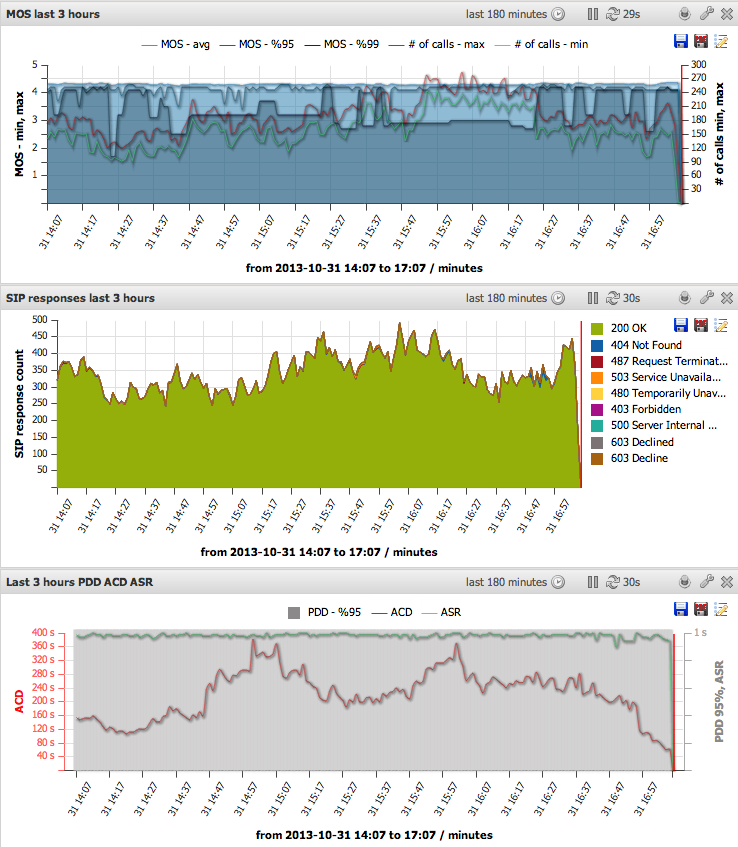
Dashboard allows placing panels with various types of data which can be refreshed on regular basis. The main purpose of this feature is to have realtime overview on the whole system or part of it. You can create your own panel layout templates and load them whenever you need them. Each user can create his own layouts which will be visible only to him or admin can creates global layouts visible for all users. | |||
You can open dashboard template with direct URL: | |||
<code>http://localhost/voipmon/admin.php?user=yourUser&password=yourPass&dashboard=Default&hidemenu=1</code> | |||
[[File:dashboardv2.png|Dashboard default template]] | |||
== Add panel == | |||
You can add as many panels as you can fit to the main layout window. The panel can be resized and moved. The panel can be locked or unlocked so you cannot move or resize them. Current layout can be saved as template by clicking on "save" button providing name of the template. If you choose existing name of a previously created panel you will be asked if you want to replace the old one. Panels on current layout can be deleted at once by clicking on "remove all panels" button. When you click on "hide menu" the current layout will hide the left menu and current layout will have maximized size. | |||
== Panel types == | |||
When adding new panel you can choose between various panel types: | |||
== | === CDR charts === | ||
This is analogical to the [[Charts]] section. | |||
[[File:dashboardv2-cdrcharts.png|CDR charts]] | |||
=== | === SIP responses (pie chart) === | ||
'''Keywords:''' | [[File:dashboardv2-piechart.png|SIP responses pie chart]] | ||
=== Top IP addresses === | |||
[[File:dashboardv2-topip.png|Top IP addresses]] | |||
=== Custom CDR grid - by SIP IP === | |||
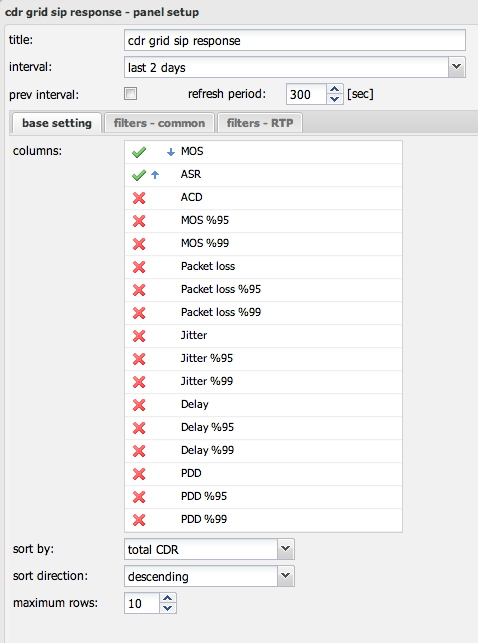
Custom grids allows to see total numbers of CDR grouped by source IP or destination IP and configure custom columns like MOS, Loss, Delay etc. You can also choose which column will be sorted by default. | |||
[[File:dashboardv2-customcdrform.png|Custom CDR grid - form]] | |||
[[File:dashboardv2-customcdrgridbyip.png|Custom CDR grid - by SIP IP]] | |||
=== Custom CDR grid - by SIP response === | |||
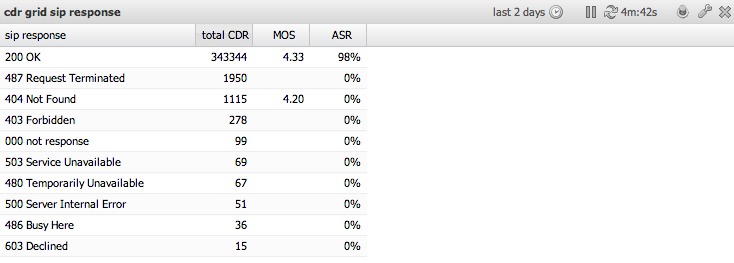
Custom CDR grid by SIP responses are identical to Custom CDR grid - by SIP IP except the CDR rows are grouped by SIP responses instead of IP addresses. This is handful in case you need to see SIP responses numbers. | |||
[[File:dashboardv2-customcdrgridbyresponse.png|Custom CDR grid - by SIP response]] | |||
=== Register charts (beta) === | |||
This panel type visualizes SIP registration statistics on the dashboard. You can display various registration metrics including successful registrations, failed registrations, and registration states. | |||
To create a dashboard with register charts: | |||
# Navigate to '''GUI > Dashboard''' view | |||
# Click "new" or "create" to create a new dashboard | |||
# Select a desired layout for the dashboard | |||
# For each new panel, choose the panel type "Register charts beta" from the dropdown menu | |||
# After creating the panel, edit its settings to select a template or specific register series to display | |||
Register charts require the SIP Register feature to be enabled. See [[Register]] for detailed configuration steps. | |||
== AI Summary for RAG == | |||
'''Summary:''' The Dashboard feature provides a customizable real-time monitoring interface with multiple panel types. Users can create personal layouts or admins can create global templates visible to all users. Available panel types include: CDR charts (similar to Charts section), SIP responses pie chart, Top IP addresses, Custom CDR grids grouped by SIP IP or SIP response (with configurable columns for MOS, Loss, Delay), and Register charts (beta) for SIP registration statistics. Panels can be resized, moved, locked/unlocked, and saved as templates. Direct URL access is supported with parameters for user authentication, dashboard name, and menu hiding. | |||
'''Keywords:''' dashboard, panels, real-time monitoring, CDR charts, SIP responses, pie chart, top IP, custom grid, MOS, Loss, Delay, register charts, layout templates, global layouts, user layouts, hidemenu | |||
'''Key Questions:''' | '''Key Questions:''' | ||
* What | * How do I create a custom dashboard in VoIPmonitor? | ||
* How do I | * What panel types are available in the Dashboard? | ||
* How do I | * How do I save a dashboard layout as a template? | ||
* | * How do I access the dashboard via direct URL? | ||
* How do I | * How do I add register charts to the dashboard? | ||
* Can I create a dashboard visible to all users? | |||
* How do I display MOS/Loss/Delay metrics on the dashboard? | |||
* How do I group CDR data by SIP response on the dashboard? | |||
Revision as of 11:23, 6 January 2026
Dashboard
Dashboard allows placing panels with various types of data which can be refreshed on regular basis. The main purpose of this feature is to have realtime overview on the whole system or part of it. You can create your own panel layout templates and load them whenever you need them. Each user can create his own layouts which will be visible only to him or admin can creates global layouts visible for all users.
You can open dashboard template with direct URL:
http://localhost/voipmon/admin.php?user=yourUser&password=yourPass&dashboard=Default&hidemenu=1
Add panel
You can add as many panels as you can fit to the main layout window. The panel can be resized and moved. The panel can be locked or unlocked so you cannot move or resize them. Current layout can be saved as template by clicking on "save" button providing name of the template. If you choose existing name of a previously created panel you will be asked if you want to replace the old one. Panels on current layout can be deleted at once by clicking on "remove all panels" button. When you click on "hide menu" the current layout will hide the left menu and current layout will have maximized size.
Panel types
When adding new panel you can choose between various panel types:
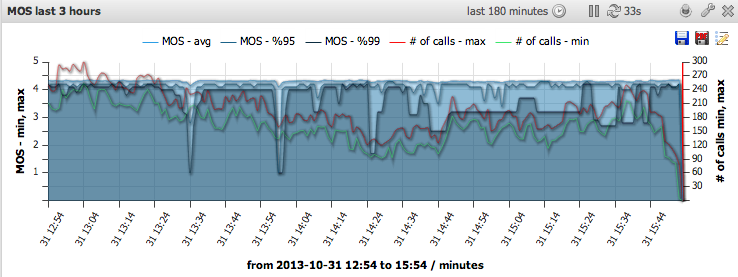
CDR charts
This is analogical to the Charts section.
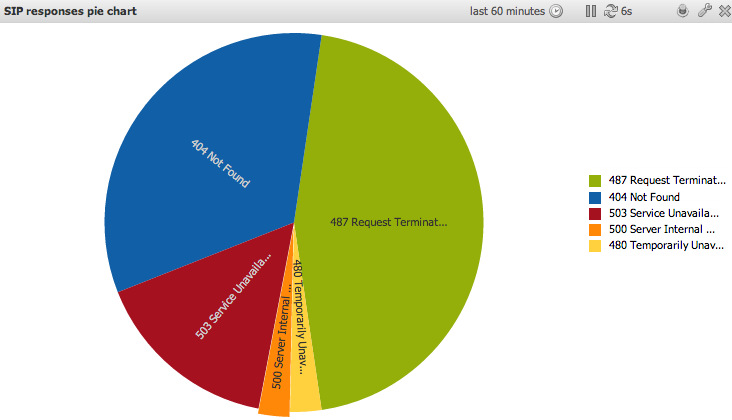
SIP responses (pie chart)
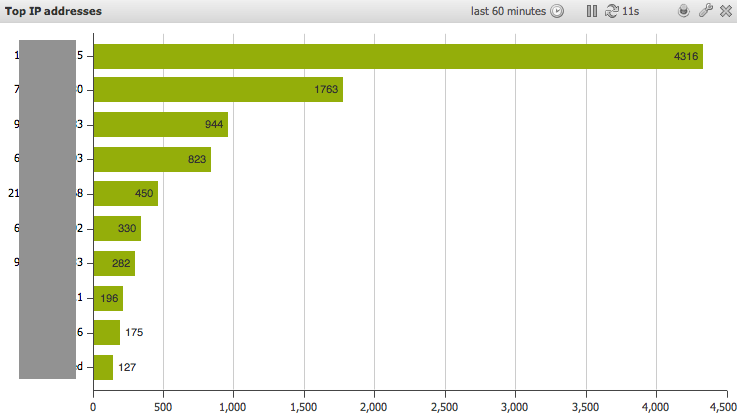
Top IP addresses
Custom CDR grid - by SIP IP
Custom grids allows to see total numbers of CDR grouped by source IP or destination IP and configure custom columns like MOS, Loss, Delay etc. You can also choose which column will be sorted by default.
Custom CDR grid - by SIP response
Custom CDR grid by SIP responses are identical to Custom CDR grid - by SIP IP except the CDR rows are grouped by SIP responses instead of IP addresses. This is handful in case you need to see SIP responses numbers.
Register charts (beta)
This panel type visualizes SIP registration statistics on the dashboard. You can display various registration metrics including successful registrations, failed registrations, and registration states.
To create a dashboard with register charts:
- Navigate to GUI > Dashboard view
- Click "new" or "create" to create a new dashboard
- Select a desired layout for the dashboard
- For each new panel, choose the panel type "Register charts beta" from the dropdown menu
- After creating the panel, edit its settings to select a template or specific register series to display
Register charts require the SIP Register feature to be enabled. See Register for detailed configuration steps.
AI Summary for RAG
Summary: The Dashboard feature provides a customizable real-time monitoring interface with multiple panel types. Users can create personal layouts or admins can create global templates visible to all users. Available panel types include: CDR charts (similar to Charts section), SIP responses pie chart, Top IP addresses, Custom CDR grids grouped by SIP IP or SIP response (with configurable columns for MOS, Loss, Delay), and Register charts (beta) for SIP registration statistics. Panels can be resized, moved, locked/unlocked, and saved as templates. Direct URL access is supported with parameters for user authentication, dashboard name, and menu hiding.
Keywords: dashboard, panels, real-time monitoring, CDR charts, SIP responses, pie chart, top IP, custom grid, MOS, Loss, Delay, register charts, layout templates, global layouts, user layouts, hidemenu
Key Questions:
- How do I create a custom dashboard in VoIPmonitor?
- What panel types are available in the Dashboard?
- How do I save a dashboard layout as a template?
- How do I access the dashboard via direct URL?
- How do I add register charts to the dashboard?
- Can I create a dashboard visible to all users?
- How do I display MOS/Loss/Delay metrics on the dashboard?
- How do I group CDR data by SIP response on the dashboard?
