Tools: Difference between revisions
(Add documentation about IP lookup network masks and how /24 mask causes same hostname for multiple IPs in subnet) |
(Rewrite: konsolidace a vylepšení struktury - zjednodušení IP lookup sekce, přidání tabulek, See Also) |
||
| Line 1: | Line 1: | ||
= Tools = | = Tools = | ||
Diagnostic and utility tools available in the VoIPmonitor GUI ('''GUI > Tools'''). | |||
== MTR == | == MTR == | ||
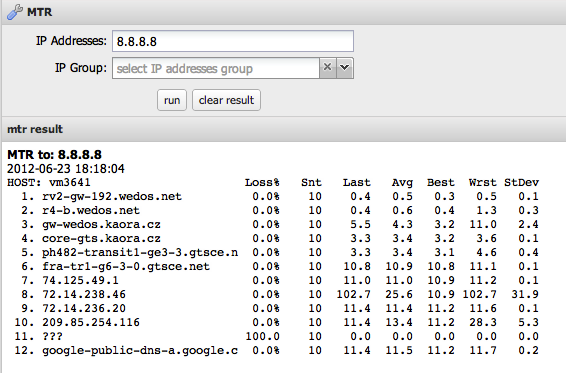
Network path tracing from VoIPmonitor web server to a selected IP address using the Linux <code>mtr</code> tool. | |||
* '''Duration:''' 10 seconds | |||
* '''Packets:''' 10 | |||
[[File:tools-mtr.png]] | [[File:tools-mtr.png]] | ||
| Line 11: | Line 14: | ||
== IP Lookup == | == IP Lookup == | ||
IP | Substitutes IP addresses with custom hostnames in CDR views and other displays. Takes precedence over DNS lookups. | ||
'''Enable:''' Settings > System Configuration > "database IP reverse lookup" | |||
{| class="wikitable" | |||
! Mask !! Scope !! Example | |||
|- | |||
| /32 || Single IP only || 192.168.1.100/32 applies to only 192.168.1.100 | |||
|- | |||
| /24 || Entire subnet (256 IPs) || 192.168.1.0/24 applies to 192.168.1.0 - 192.168.1.255 | |||
|} | |||
{{Note|1=If the same hostname appears for multiple IPs, the entry likely uses a subnet mask (e.g., /24). Change to '''/32''' for per-IP hostnames.}} | |||
[[File:tools-iplookup.png]] | [[File:tools-iplookup.png]] | ||
| Line 42: | Line 32: | ||
== Prefix Lookup == | == Prefix Lookup == | ||
Substitutes phone numbers with custom labels in CDR views. Takes precedence over IP lookup and DNS. | |||
'''Enable:''' Set <code>ENABLE_SQL_CUSTOMER_PREFIX_LOOKUP = true</code> in <code>config/configuration.php</code> | |||
[[File:tools-prefixlookup.png]] | [[File:tools-prefixlookup.png]] | ||
| Line 48: | Line 40: | ||
== Load PCAP == | == Load PCAP == | ||
Upload PCAP files (libpcap format | Upload and process PCAP files (libpcap format from tcpdump, tshark, Wireshark) to create CDRs. | ||
<syntaxhighlight lang="bash"> | <syntaxhighlight lang="bash"> | ||
| Line 54: | Line 46: | ||
</syntaxhighlight> | </syntaxhighlight> | ||
'''Config path:''' Settings > System Configuration > "Upload sniffer conf path" | |||
{{Tip|Use this feature for '''pre-deployment verification''' - upload sample traffic (VoLTE, WebRTC, etc.) to confirm VoIPmonitor can parse the protocol before deploying live mirroring.}} | |||
== Batch Download CDR WAV == | == Batch Download CDR WAV == | ||
Download | Download multiple audio recordings via CSV upload. | ||
[[File:tools-batchwav.png]] | [[File:tools-batchwav.png]] | ||
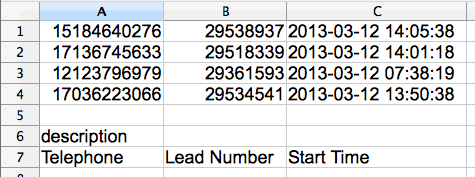
'''CSV columns:''' | |||
{| class="wikitable" | |||
! Column !! Description | |||
|- | |||
| Telephone || Caller or Called number | |||
|- | |||
| Lead Number || Record identifier (exported with audio/PCAP) | |||
|- | |||
| Start Time || CDR timestamp (second pass uses +/-5 min if no exact match) | |||
|} | |||
[[File:tools-batchwav-examplecsv.png]] | [[File:tools-batchwav-examplecsv.png]] | ||
== Generate Debug Log == | == Generate Debug Log == | ||
Creates a comprehensive diagnostic package for VoIPmonitor support escalation. | |||
'''Contents:''' | |||
* System info (OS, kernel, CPU, RAM) | |||
* VoIPmonitor configuration | |||
* Performance logs and errors | |||
* Sensor status and capture stats | |||
* Network/storage info | |||
# Navigate to ''' | '''How to use:''' | ||
# Enter your email address | # Navigate to '''Tools > Generate debug log''' | ||
# Enter your email address | |||
# Click '''Generate''' | # Click '''Generate''' | ||
# | # Share the received link with support | ||
{{Warning|Use after initial troubleshooting fails. First check [[Settings#Sensor_Health_Monitoring_with_RRD_Charts|Sensor RRD Charts]] and logs.}} | |||
[[File:tools-generatedebuglog.png]] | [[File:tools-generatedebuglog.png]] | ||
| Line 128: | Line 92: | ||
== Concurrent Calls Stats == | == Concurrent Calls Stats == | ||
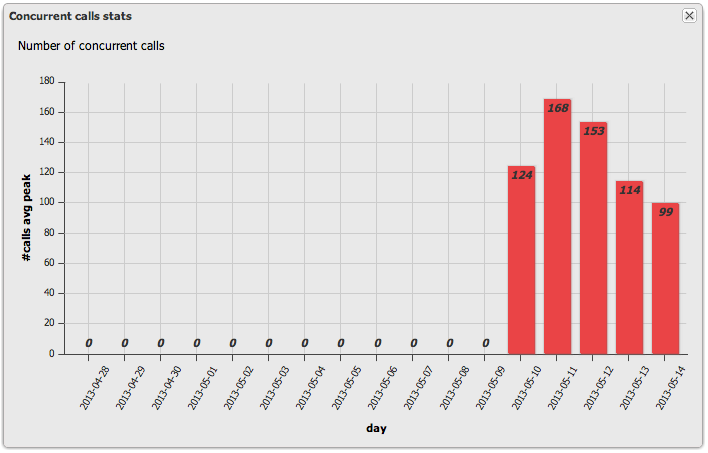
Displays maximum concurrent connected calls for the last 14 days, averaged over 60-minute windows. | |||
* '''Licensing:''' Counts all CDR legs (100 calls with 2 legs = 200 counted) | |||
* '''Exceeded limit:''' Sniffer continues, but GUI warns/blocks after 14 days | |||
For license details, see [[License]]. | |||
[[File:tools-concurrentcallsstat.png]] | [[File:tools-concurrentcallsstat.png]] | ||
== See Also == | |||
* [[Settings]] - System configuration and sensor management | |||
* [[License]] - Channel licensing and limits | |||
* [[GUI_troubleshooting]] - GUI debug mode and troubleshooting | |||
== AI Summary for RAG == | == AI Summary for RAG == | ||
'''Summary:''' | '''Summary:''' VoIPmonitor GUI tools documentation covering: MTR (network path tracing from web server), IP Lookup (IP-to-hostname substitution with CIDR masks - /32 for single IP, /24 for subnet), Prefix Lookup (phone number substitution), Load PCAP (upload PCAP files for CDR creation and pre-deployment protocol verification), Batch Download WAV (bulk audio export via CSV), Generate Debug Log (diagnostic package for support), and Concurrent Calls Stats (license monitoring showing max concurrent calls over 14 days). | ||
'''Keywords:''' MTR, IP lookup, network mask, CIDR | '''Keywords:''' tools, MTR, IP lookup, network mask, CIDR, /32, /24, hostname substitution, prefix lookup, PCAP upload, pre-deployment verification, batch WAV download, generate debug log, concurrent calls stats, license monitoring, VoLTE, WebRTC | ||
'''Key Questions:''' | '''Key Questions:''' | ||
* What | * What diagnostic tools are available in VoIPmonitor GUI? | ||
* How | * How do I trace network path from VoIPmonitor server? | ||
* Why does the same hostname appear for multiple | * How do I substitute IP addresses with hostnames in CDR view? | ||
* How do network masks | * Why does the same hostname appear for multiple IPs? | ||
* How do network masks (/32 vs /24) work in IP lookup? | |||
* How do I enable prefix lookup for phone numbers? | |||
* How | * How do I upload PCAP files to VoIPmonitor? | ||
* How | * How can I verify if VoIPmonitor supports a specific protocol before deployment? | ||
* How | * How do I download multiple audio files at once? | ||
* | * How do I generate a debug log for VoIPmonitor support? | ||
* How | * How do I check concurrent call statistics for licensing? | ||
Latest revision as of 16:47, 8 January 2026
Tools
Diagnostic and utility tools available in the VoIPmonitor GUI (GUI > Tools).
MTR
Network path tracing from VoIPmonitor web server to a selected IP address using the Linux mtr tool.
- Duration: 10 seconds
- Packets: 10
IP Lookup
Substitutes IP addresses with custom hostnames in CDR views and other displays. Takes precedence over DNS lookups.
Enable: Settings > System Configuration > "database IP reverse lookup"
| Mask | Scope | Example |
|---|---|---|
| /32 | Single IP only | 192.168.1.100/32 applies to only 192.168.1.100 |
| /24 | Entire subnet (256 IPs) | 192.168.1.0/24 applies to 192.168.1.0 - 192.168.1.255 |
ℹ️ Note: If the same hostname appears for multiple IPs, the entry likely uses a subnet mask (e.g., /24). Change to /32 for per-IP hostnames.
Prefix Lookup
Substitutes phone numbers with custom labels in CDR views. Takes precedence over IP lookup and DNS.
Enable: Set ENABLE_SQL_CUSTOMER_PREFIX_LOOKUP = true in config/configuration.php
Load PCAP
Upload and process PCAP files (libpcap format from tcpdump, tshark, Wireshark) to create CDRs.
voipmonitor --config-file /etc/voipmonitor.conf -r upload.pcap
Config path: Settings > System Configuration > "Upload sniffer conf path"
💡 Tip: Use this feature for pre-deployment verification - upload sample traffic (VoLTE, WebRTC, etc.) to confirm VoIPmonitor can parse the protocol before deploying live mirroring.
Batch Download CDR WAV
Download multiple audio recordings via CSV upload.
CSV columns:
| Column | Description |
|---|---|
| Telephone | Caller or Called number |
| Lead Number | Record identifier (exported with audio/PCAP) |
| Start Time | CDR timestamp (second pass uses +/-5 min if no exact match) |
Generate Debug Log
Creates a comprehensive diagnostic package for VoIPmonitor support escalation.
Contents:
- System info (OS, kernel, CPU, RAM)
- VoIPmonitor configuration
- Performance logs and errors
- Sensor status and capture stats
- Network/storage info
How to use:
- Navigate to Tools > Generate debug log
- Enter your email address
- Click Generate
- Share the received link with support
⚠️ Warning: Use after initial troubleshooting fails. First check Sensor RRD Charts and logs.
File:Tools-generatedebuglog.png
Concurrent Calls Stats
Displays maximum concurrent connected calls for the last 14 days, averaged over 60-minute windows.
- Licensing: Counts all CDR legs (100 calls with 2 legs = 200 counted)
- Exceeded limit: Sniffer continues, but GUI warns/blocks after 14 days
For license details, see License.
See Also
- Settings - System configuration and sensor management
- License - Channel licensing and limits
- GUI_troubleshooting - GUI debug mode and troubleshooting
AI Summary for RAG
Summary: VoIPmonitor GUI tools documentation covering: MTR (network path tracing from web server), IP Lookup (IP-to-hostname substitution with CIDR masks - /32 for single IP, /24 for subnet), Prefix Lookup (phone number substitution), Load PCAP (upload PCAP files for CDR creation and pre-deployment protocol verification), Batch Download WAV (bulk audio export via CSV), Generate Debug Log (diagnostic package for support), and Concurrent Calls Stats (license monitoring showing max concurrent calls over 14 days).
Keywords: tools, MTR, IP lookup, network mask, CIDR, /32, /24, hostname substitution, prefix lookup, PCAP upload, pre-deployment verification, batch WAV download, generate debug log, concurrent calls stats, license monitoring, VoLTE, WebRTC
Key Questions:
- What diagnostic tools are available in VoIPmonitor GUI?
- How do I trace network path from VoIPmonitor server?
- How do I substitute IP addresses with hostnames in CDR view?
- Why does the same hostname appear for multiple IPs?
- How do network masks (/32 vs /24) work in IP lookup?
- How do I enable prefix lookup for phone numbers?
- How do I upload PCAP files to VoIPmonitor?
- How can I verify if VoIPmonitor supports a specific protocol before deployment?
- How do I download multiple audio files at once?
- How do I generate a debug log for VoIPmonitor support?
- How do I check concurrent call statistics for licensing?


