Tools
MTR
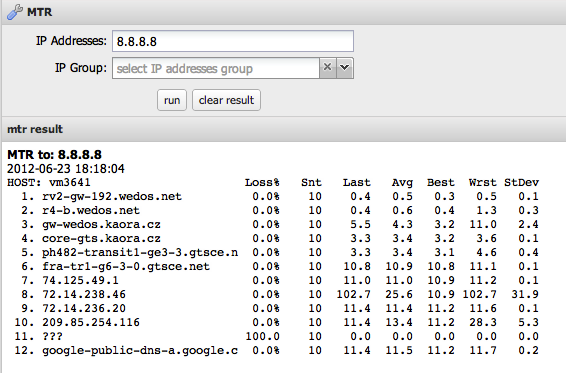
MTR traces from VoIPmonitor WEB server to selected IP using Linux mtr tool (10 seconds, 10 packets).
IP Lookup
IP lookup table substitutes IPs in places like CDR view, taking precedence over DNS. Enable via "database IP reverse lookup" in Settings > System Configuration.
Prefix Lookup
Prefix lookup table substitutes numbers in places like CDR view, taking precedence over IP lookup/DNS. Enable by setting ENABLE_SQL_CUSTOMER_PREFIX_LOOKUP to true in config/configuration.php.
Load PCAP
Upload PCAP files (libpcap format: tcpdump, tshark, Wireshark, voipmonitor). Processed by:
voipmonitor --config-file /etc/voipmonitor.conf -r upload.pcap
Change conf path in Settings > System Configuration > Upload sniffer conf path.
Pre-Deployment Verification
This feature is commonly used to verify whether VoIPmonitor can monitor and parse specific types of traffic before full deployment. For example, to test VoLTE, WebRTC, or custom protocol implementations:
1. Obtain a sample PCAP file containing the traffic type you want to monitor (VoLTE test call, WebRTC session, etc.) 2. Log in to the VoIPmonitor GUI and navigate to Tools > Load PCAP 3. Upload the PCAP file 4. Check if CDRs (Call Detail Records) are created in the CDR view
If CDRs are successfully created from the uploaded PCAP, this confirms that VoIPmonitor can parse and monitor that specific traffic type. This is the recommended way to verify protocol compatibility without setting up live network mirroring.
Batch Download CDR WAV
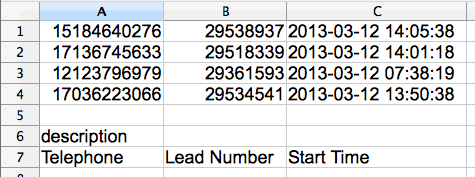
Download WAVs in batch via CSV upload.
Example CSV:
Details:
- Telephone: Caller or Called number.
- Lead Number: Identifies record in CSV log (exported with audio/PCAP).
- Start Time: Locates CDR; second pass uses +-5 minutes if not exact.
Generate Debug Log
Generate a comprehensive debug report for troubleshooting issues with VoIPmonitor support. This feature collects system information, configuration files, and diagnostic logs into a single package.
- How to Generate a Debug Log:**
1. Navigate to GUI > Tools > Generate debug log 2. Enter your email address where you want to receive the debug log link 3. Click Generate 4. The system will process and upload the debug report 5. A download link will be sent to your email address 6. Share this link with VoIPmonitor support for analysis
- What the Debug Report Contains:**
- System information (OS version, kernel, CPU, memory)
- VoIPmonitor configuration files (voipmonitor.conf)
- Performance logs and recent error messages
- Sensor status and capture statistics
- Network and storage information
- Database connection status
- When to Use Generate Debug Log:**
After performing initial diagnostics and you need to escalate to VoIPmonitor support:
- You have identified a sensor issue (e.g., via Settings > Sensor RRD charts) but cannot resolve it independently
- System shows recurring errors like "packetbuffer: MEMORY IS FULL" that persist after configuration changes
- You need detailed root cause analysis from VoIPmonitor developers
- Diagnostics indicate a potential bug or unexpected behavior
- Workflow Example: Troubleshooting "packetbuffer: MEMORY IS FULL" with Bad MOS**
1. Use Settings > Sensor RRD charts to confirm buffer usage pattern (Settings: Sensor RRD Charts) 2. Adjust the From date to compare buffer usage before and after the issue started 3. Correlate buffer usage spikes with the timing of errors and bad MOS scores 4. Check kernel messages for storage errors (dmesg -T) 5. If unable to resolve, navigate to Tools > Generate debug log 6. Enter your email and generate the report 7. Share the provided link with VoIPmonitor support
File:Tools-generatedebuglog.png
Concurrent Calls Stats
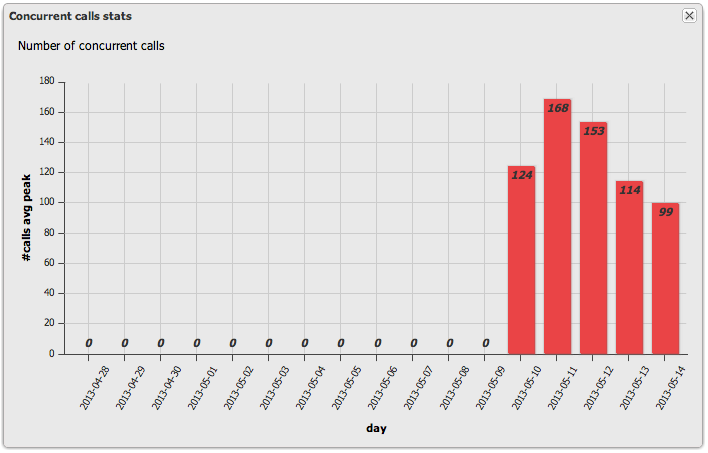
Shows max concurrent calls (connected) stats for last 14 days, averaged over 60-minute windows: Max average from minute-by-minute counts.
Applies to GUI licensing. Counts all CDR legs (e.g., 100 calls with 2 legs = 200). License needed for actual calls (e.g., 100).
If over license, sniffer continues but GUI warns/blocks in 14 days; contact support.
AI Summary for RAG
Summary: This article describes VoIPmonitor tools: MTR tracing, IP/prefix lookups (with enabling), PCAP upload/processing for pre-deployment verification, batch WAV downloads via CSV, concurrent calls stats for licensing, and GENERATE DEBUG LOG (creates comprehensive debug report for troubleshooting with VoIPmonitor support - navigate to GUI > Tools > Generate debug log, enter email, click Generate - includes system information, configuration files, performance logs, sensor status. Use after performing initial diagnostics like sensor RRD charts but before escalating to support. Workflow example for packetbuffer: MEMORY IS FULL with bad MOS: use Settings > Sensor RRD charts, adjust From date to compare buffer usage before/after issue started, check kernel messages (dmesg -T), then navigate to Tools > Generate debug log, enter email, generate report, and share link with support).
Keywords: MTR, IP lookup, prefix lookup, PCAP upload, pre-deployment verification, batch WAV, concurrent calls, generate debug log, debug report, troubleshoot with support, debug package, system information, configuration files, performance logs, sensor status, escalate to support Key Questions:
- What is MTR in VoIPmonitor?
- How to enable IP lookup?
- How to enable prefix lookup?
- How to upload and process PCAP files?
- How to verify if VoIPmonitor can monitor specific traffic types (VoLTE, WebRTC)?
- How does batch CDR WAV download work?
- What are concurrent calls stats and their licensing impact?


