Blog
VoIPmonitor Development Blog
This page contains announcements about new features and improvements in VoIPmonitor sniffer and GUI.
January 2026: Enhanced Sensor Monitoring & Disk I/O Analytics
We are excited to announce major improvements to sensor monitoring capabilities in both the sniffer and GUI.
New Disk I/O Monitoring System
The sniffer now includes comprehensive disk I/O monitoring with automatic calibration:
- Automatic Baseline Calibration - On startup, the sniffer performs a quick calibration to determine your disk's baseline performance (throughput knee point and baseline latency)
- Real-time Metrics - Continuous monitoring of:
- Disk utilization percentage
- Capacity percentage (relative to calibrated knee point)
- Write/Read throughput (MB/s)
- Write/Read IOPS
- Write latency with comparison to baseline
- I/O queue depth
- Saturation Detection - Automatic detection when disk cannot keep up with spool writes, displayed in syslog status line as
DISK_SATorIO_WARN - New RRD Graphs - Three new graph types:
- Disk I/O Saturation - Shows utilization % and capacity %
- Disk I/O Throughput - Write/Read MB/s with mirrored IOPS on right axis (dual Y-axis with dynamic scaling)
- Disk I/O Latency - Write latency with queue depth on right axis
Redesigned Sensor Detail Page
The GUI sensor detail page has been completely redesigned to provide a unified view of all sensor performance data:
https://www.voipmonitor.org/uploads/img_2026-01-23_18-09-28_6973ab48eace5.png
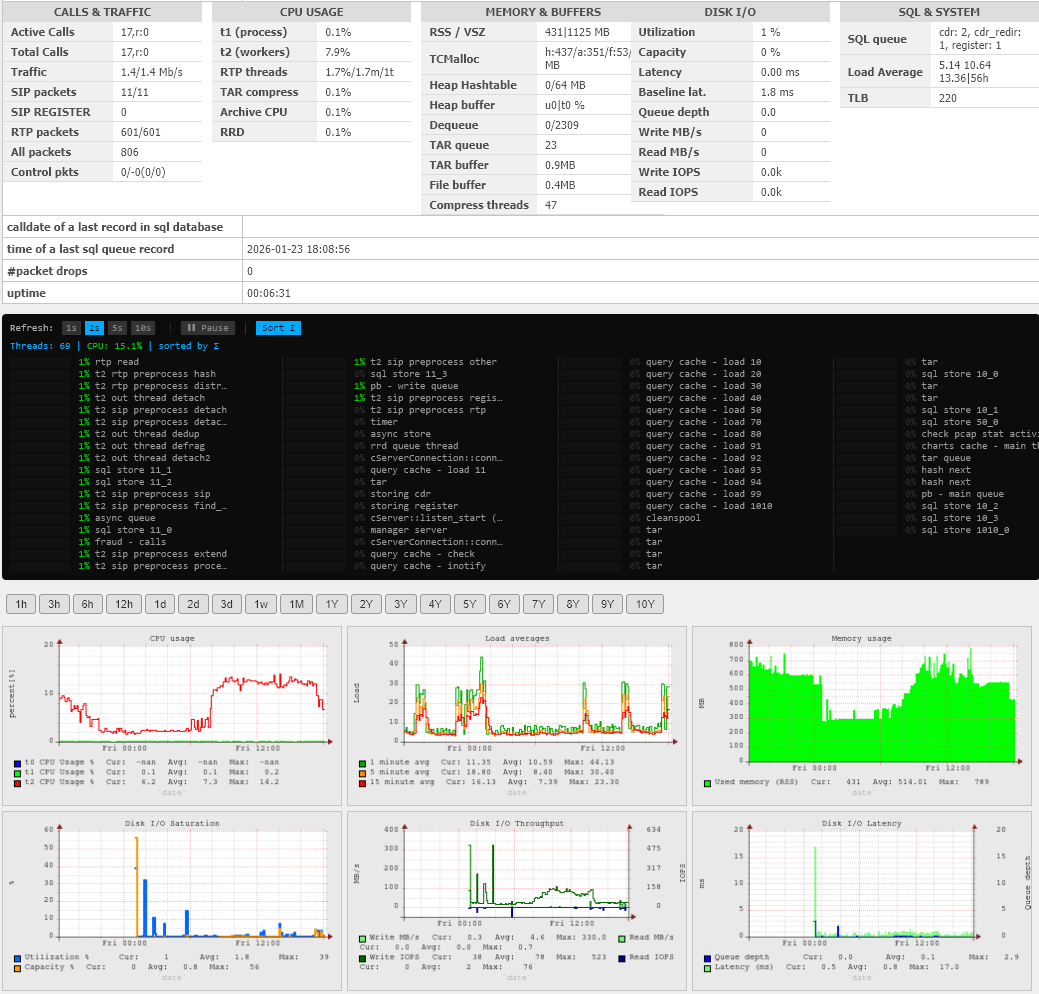
Screenshot: New sensor detail page showing unified statistics dashboard, real-time thread monitor, and RRD graphs including new Disk I/O metrics
The new layout includes:
Statistics Dashboard
A comprehensive table showing real-time metrics organized into columns:
- CALLS & TRAFFIC - Active calls, total calls, traffic rate, packet counters (SIP, RTP, etc.)
- CPU USAGE - Per-thread CPU breakdown (t1, t2 workers, RTP threads, TAR compress, etc.)
- MEMORY & BUFFERS - RSS/VSZ, TCMalloc stats, heap hashtable, buffers, queues
- DISK I/O - All new I/O metrics with color-coded warnings
- SQL & SYSTEM - SQL queue stats, load average, TLB entries
Real-time Thread Monitor
- Live CPU usage for all ~70 sniffer threads
- Mini sparkline graphs showing CPU history
- Color-coded indicators (green/orange/red based on usage)
- Sortable by CPU integral (Σ) to identify consistently busy threads
- Refresh interval controls (1s, 2s, 5s, 10s)
RRD Performance Graphs
- Time period selection from 1 hour to 10 years
- Graphs displayed in organized groups:
- CPU, Load averages, Memory
- Disk I/O Saturation, Throughput, Latency (NEW)
- Heap/Buffers, Network speed, Packet drops
- Calls, SQL queues
- Packet statistics
Why This Matters
These improvements make it significantly easier to identify performance bottlenecks:
- CPU Bottlenecks - The thread monitor immediately shows which threads are overloaded. The critical t0 (packet capture) thread is highlighted - if it reaches 90%+, packets will be dropped.
- I/O Bottlenecks - The new Disk I/O metrics show exactly when your storage cannot keep up:
- High Capacity % means you're approaching the disk's throughput limit
- High Latency ratio (current/baseline) indicates I/O contention
- DISK_SAT status means immediate action is needed
- Historical Analysis - RRD graphs let you correlate issues across time - see if CPU spikes coincide with I/O saturation or traffic bursts.
Configuration
Disk I/O monitoring is enabled by default. Configuration options in voipmonitor.conf:
; Disk I/O monitoring (enabled by default when spooldir is set)
disk_io_monitor = yes

; Warning threshold (percentage of calibrated capacity)
disk_io_warning_threshold = 80

; Saturation threshold
disk_io_saturation_threshold = 95

; Recalibrate baseline (useful after hardware changes)
; Send manager command: disk_io_recalibrate
Availability
These features are available in:
- Sniffer version 2026.01.3 and newer
- GUI version 2026.1.3 and newer
For questions or feedback, please contact support@voipmonitor.org.