Alerts
Category:GUI manual
Alerts & Reports
Alerts & Reports generate email notifications based on QoS parameters or SIP error conditions. The system includes daily reports, ad hoc reports, and stores all generated items in history.
Overview
The alert system monitors call quality and SIP signaling in real-time, triggering notifications when configured thresholds are exceeded.
Email Configuration Prerequisites
Emails are sent using PHP's mail() function, which relies on the server's Mail Transfer Agent (MTA) such as Exim, Postfix, or Sendmail. Configure your MTA according to your Linux distribution documentation.
Setting Up the Cron Job
Alert processing requires a cron job that runs every minute:
# Add to /etc/crontab (adjust path based on your GUI installation)
echo "* * * * * root php /var/www/html/php/run.php cron" >> /etc/crontab

# Reload crontab
killall -HUP cron   # Debian/Ubuntu
# or
killall -HUP crond  # CentOS/RHEL
Configure Alerts
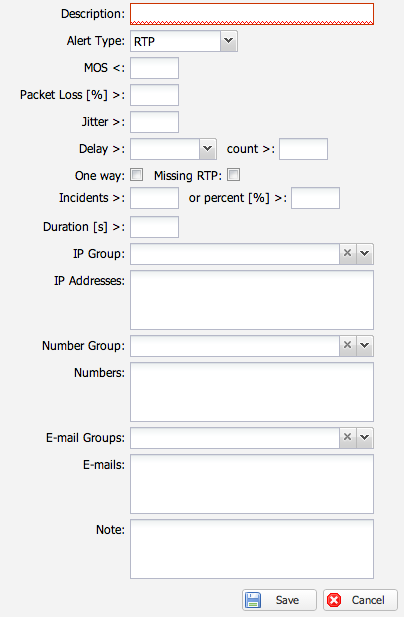
Email alerts can trigger on SIP protocol events or RTP QoS metrics. Access alerts configuration via GUI > Alerts.

Alert Types
RTP Alerts
RTP alerts trigger based on voice quality metrics:
- MOS (Mean Opinion Score) - below threshold
- Packet loss - percentage exceeded
- Jitter - variation exceeded
- Delay (PDV) - latency exceeded
- One-way calls - answered but one RTP stream missing
- Missing RTP - answered but both RTP streams missing
Configure alerts to trigger when:
- Number of incidents exceeds a set value, OR
- Percentage of CDRs exceeds a threshold

SIP Response Alerts
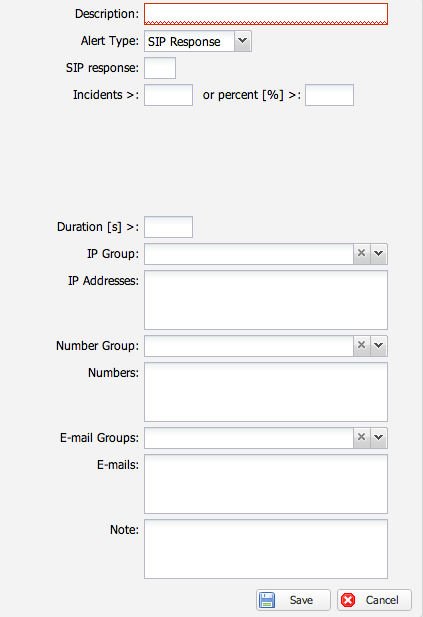
SIP response alerts trigger based on SIP response codes:
- Empty response field: Matches all call attempts per configured filters
- Response code 0: Matches unreplied INVITE requests (no response received)
- Specific codes: Match exact codes like 404, 503, etc.

Sensors Alerts
Sensors alerts monitor the health of VoIPmonitor probes and sniffer instances. This is the most reliable method to check if remote sensors are online and actively monitoring traffic.
Unlike simple network port monitoring (which may show a port as open even if the process is frozen or unresponsive), sensors alerts verify that the sensor instance is actively communicating with the VoIPmonitor GUI server.
- Setup
-
- Configure sensors in Settings > Sensors
- Create a sensors alert to be notified when a probe goes offline or becomes unresponsive
SIP REGISTER RRD Beta Alerts
The SIP REGISTER RRD beta alert type monitors SIP REGISTER response times and alerts when REGISTER packets do not receive a response within a specified threshold (in milliseconds). This is useful for detecting network latency issues, packet loss, or failing switches that cause SIP retransmissions.
This alert serves as an effective proxy to monitor for registration issues, as REGISTER retransmissions often indicate problems with network connectivity or unresponsive SIP servers.
- Configuration
-
- Navigate to GUI > Alerts
- Create a new alert with type SIP REGISTER RRD beta
- Set the response time threshold in milliseconds (e.g., alert if REGISTER does not receive a response within 2000ms)
- Configure recipient email addresses
- Save the alert configuration
The system monitors REGISTER packets and triggers an alert when responses exceed the configured threshold, indicating potential SIP registration failures or network issues.

Common Filters
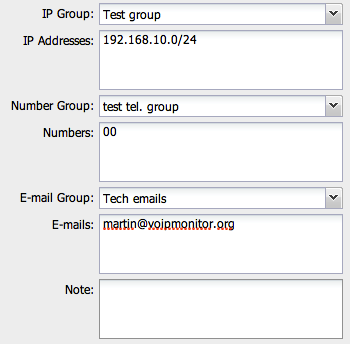
All alert types support the following filters:
| Filter | Description |
|---|---|
| IP/Number Group | Apply alert to predefined groups (from Groups menu) |
| IP Addresses | Individual IPs or ranges (one per line) |
| Numbers | Individual phone numbers or prefixes (one per line) |
| Email Group | Send alerts to group-defined email addresses |
| Emails | Individual recipient emails (one per line) |

Sent Alerts
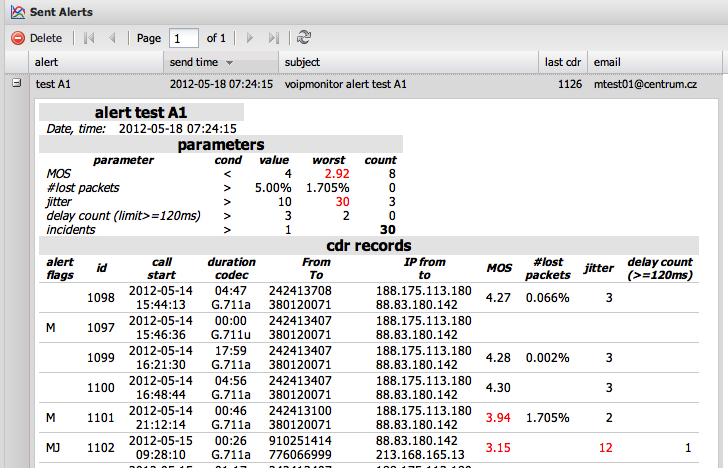
All triggered alerts are saved in history and can be viewed via GUI > Alerts > Sent Alerts. The content matches what was sent via email.

Parameters Table
The parameters table shows QoS metrics with problematic values highlighted for quick identification.

CDR Records Table
The CDR records table lists all calls that triggered the alert. Each row includes alert flags indicating which thresholds were exceeded:
- (M) - MOS below threshold
- (J) - Jitter exceeded
- (P) - Packet loss exceeded
- (D) - Delay exceeded
Anti-Fraud Alerts
VoIPmonitor includes specialized anti-fraud alert rules for detecting attacks and fraudulent activity. These include:
- Realtime concurrent calls monitoring
- SIP REGISTER flood/attack detection
- SIP PACKETS flood detection
- Country/Continent destination alerts
- CDR/REGISTER country change detection
For detailed configuration of anti-fraud rules and custom action scripts, see Anti-Fraud Rules.
Alerts Based on Custom Reports
In addition to native alert types (RTP, SIP response, Sensors), VoIPmonitor supports generating alerts from custom reports. This workflow enables alerts based on criteria not available in native alert types, such as SIP header values captured via CDR custom headers.
Workflow Overview =
1. Capture custom SIP headers in the database 2. Create a custom report filtered by the custom header values 3. Generate an alert from that report 4. Configure alert email options (e.g., limit email size)
Example: Alert on SIP Max-Forwards Header Value =
This example shows how to receive an alert when the SIP Max-Forwards header value drops below 15.
Step 1: Configure Sniffer Capture
Add the header to your /etc/voipmonitor.conf configuration file:
# Capture Max-Forwards header
custom_headers = Max-Forwards
Restart the sniffer to apply changes:
service voipmonitor restart
Step 2: Configure Custom Header in GUI
1. Navigate to GUI > Settings > CDR Custom Headers
2. Select Max-Forwards from the available headers
3. Enable Show as Column to display it in CDR views
4. Save configuration
Step 3: Create Custom Report
1. Navigate to GUI > CDR Custom Headers or use the Report Generator
2. Create a filter for calls where Max-Forwards is less than 15
3. Since custom headers store string values, use a filter expression that matches the desired values:
15 14 13 12 11 10 0_ _
Include additional space-separated values or use NULL to match other ranges as needed.
4. Run the report to verify it captures the expected calls
Step 4: Generate Alert from Report
You can create an alert based on this custom report using the Daily Reports feature:
1. Navigate to GUI > Reports > Configure Daily Reports 2. Click Add Daily Report 3. Configure the filter to target the custom header criteria (e.g., Max-Forwards < 15) 4. Set the schedule (e.g., run every hour) 5. Save the daily report configuration
Step 5: Limit Alert Email Size (Optional)
If the custom report generates many matching calls, the alert email can become large. To limit the email size:
1. Edit the daily report 2. Go to the Basic Data tab 3. Set the max-lines in body option to the desired limit (e.g., 100 lines)
Additional Use Cases =
This workflow can be used for various custom monitoring scenarios:
- SIP headers beyond standard SIP response codes - Monitor any custom SIP header
- Complex filtering logic - Create reports based on multiple custom header filters
- Threshold monitoring for string fields - When numeric comparison is not available, use string matching
For more information on configuring custom headers, see CDR Custom Headers.
Troubleshooting Email Alerts
If email alerts are not being sent, the issue is typically with the Mail Transfer Agent (MTA) rather than VoIPmonitor.
Step 1: Test Email Delivery from Command Line
Before investigating complex issues, verify your server can send emails:
# Test using the 'mail' command
echo "Test email body" | mail -s "Test Subject" your.email@example.com
If this fails, the issue is with your MTA configuration, not VoIPmonitor.
Step 2: Check MTA Service Status
Ensure the MTA service is running:
# For Postfix (most common)
sudo systemctl status postfix

# For Exim (Debian default)
sudo systemctl status exim4

# For Sendmail
sudo systemctl status sendmail
If the service is not running or not installed, install and configure it according to your Linux distribution's documentation.
Step 3: Check Mail Logs
Examine the MTA logs for specific error messages:
# Debian/Ubuntu
tail -f /var/log/mail.log

# RHEL/CentOS/AlmaLinux/Rocky
tail -f /var/log/maillog
Common errors and their meanings:
| Error Message | Cause | Solution |
|---|---|---|
| Connection refused | MTA not running or firewall blocking | Start MTA service, check firewall rules |
| Relay access denied | SMTP relay misconfiguration | Configure proper relay settings |
| Authentication failed | Incorrect credentials | Verify credentials in sasl_passwd |
| Host or domain name lookup failed | DNS issues | Check /etc/resolv.conf |
| Greylisted | Temporary rejection | Wait and retry, or whitelist sender |
Step 4: Check Mail Queue
Emails may be stuck in the queue if delivery is failing:
# View the mail queue
mailq

# Force immediate delivery attempt
postqueue -f
Deferred or failed messages in the queue contain error details explaining why delivery failed.
Step 5: Verify Cronjob
Ensure the alert processing script runs every minute:
# Check current crontab
crontab -l
You should see:
* * * * * root php /var/www/html/php/run.php cron
If missing, add it:
crontab -e
# Add the line above, then reload cron
killall -HUP cron
Step 6: Verify Alert Configuration in GUI
After confirming the MTA works:
- Navigate to GUI > Alerts
- Verify alert conditions are enabled
- Check that recipient email addresses are valid
- Go to GUI > Alerts > Sent Alerts to see if alerts were triggered
Diagnosis:
- Entries in "Sent Alerts" but no emails received → MTA issue
- No entries in "Sent Alerts" → Check alert conditions or cronjob
Step 7: Test PHP mail() Function
Isolate the issue by testing PHP directly:
php -r "mail('your.email@example.com', 'Test from PHP', 'This is a test email');"
- If this works but VoIPmonitor alerts don't → Check GUI cronjob and alert configuration
- If this fails → MTA or PHP configuration issue
Troubleshooting Alerts Not Triggering
If alerts are not appearing in the Sent Alerts history at all, the problem is typically with the alert processor not evaluating alerts. This is different from MTA issues where alerts appear in history but emails are not sent.
Enable Detailed Alert Processing Logs
To debug why alerts are not being evaluated, enable detailed logging for the alert processor by adding the following line to your GUI configuration file:
# Edit the config file (adjust path based on your GUI installation)
nano ./config/system_configuration.php
Add this line at the end of the file:
<?php
define('CRON_LOG_FILE', '/tmp/alert.log');
?>
This enables logging that shows which alerts are being processed during each cron job run.
Increase Parallel Processing Threads
If you have many alerts or reports, the default number of parallel threads may cause timeout issues. Increase the parallel task limit:
# Edit the configuration file
nano ./config/configuration.php
Add this line at the end of the file:
<?php
define('CRON_PARALLEL_TASKS', 8);
?>
The value of 8 is recommended for high-load environments. Adjust based on your alert/report volume and server capacity.
Monitor Alert Processing Logs
After enabling logging, monitor the alert log file to see which alerts are being processed:
# Watch the log in real-time
tail -f /tmp/alert.log
The log shows entries like:
begin alert [alert_name]
end alert [alert_name]
Interpreting the logs:
- If you do not see your alert name in the logs → The alert processor is not evaluating it. Check your alert configuration, filters, and data availability.
- If you see the alert in logs but it does not trigger → The alert conditions are not being met. Check your thresholds, filter logic, and verify the CDR data matches your expectations.
- If logs are completely empty → The cron job may not be running or the GUI configuration files are not being loaded. Verify the cron job and file paths.
Alert Not Appearing in Logs
If your alert does not appear in `/tmp/alert.log`:
1. Verify the cron job is running:
# Check the cron job exists
crontab -l

# Manually test the cron script to see errors
php ./php/run.php cron
2. Verify data exists in CDR:
# Check if the calls that should trigger the alert exist
# Navigate to GUI > CDR > Browse and filter for the timeframe
3. Check alert configuration:
- Verify alert is enabled
- Verify filter logic matches your data (IP addresses, numbers, groups)
- Verify thresholds are reasonable for the actual QoS metrics
- Verify GUI license is not locked (Check GUI > Settings > License)
See Also
- Anti-Fraud Rules - Detailed fraud detection configuration
- Reports - Daily reports and report generator
- Sniffer Troubleshooting - General troubleshooting
AI Summary for RAG
Summary: VoIPmonitor Alerts & Reports system for email notifications on QoS and SIP issues. Covers RTP alerts (MOS, jitter, packet loss), SIP response alerts, sensors health monitoring, SIP REGISTER RRD beta alerts for monitoring registration response times, and creating alerts from custom reports based on CDR custom headers. Includes email troubleshooting for MTA configuration, and detailed debugging for alerts not triggering using CRON_LOG_FILE and CRON_PARALLEL_TASKS.
Keywords: alerts, email notifications, QoS, MOS, jitter, packet loss, SIP response, sensors monitoring, SIP REGISTER RRD beta, REGISTER retransmissions, registration monitoring, crontab, MTA, Postfix, Exim, troubleshooting, custom headers, custom reports, Max-Forwards, daily reports, CRON_LOG_FILE, CRON_PARALLEL_TASKS, alert not triggering, /tmp/alert.log, begin alert, end alert, configuration.php, system_configuration.php
Key Questions:
- How do I set up email alerts in VoIPmonitor?
- What types of alerts are available (RTP, SIP, Sensors, REGISTER RRD beta)?
- How do I monitor and alert on SIP REGISTER retransmissions?
- How do I detect registration response time issues?
- How can I use SIP REGISTER RRD beta alert for detecting switch problems?
- How do I configure crontab for alert processing?
- How do I monitor remote sensor health?
- Why are email alerts not being sent?
- How do I troubleshoot MTA email issues?
- How can I create alerts based on SIP headers like Max-Forwards?
- How do I use CDR custom headers for custom reports?
- How do I limit the size of alert emails from custom reports?
- Why are alerts not triggering or appearing in Sent Alerts?
- How do I enable detailed alert processing logs using CRON_LOG_FILE?
- How do I increase parallel alert processing threads with CRON_PARALLEL_TASKS?
- How do I monitor /tmp/alert.log for alert processing debug information?