Call Detail Record - CDR
This guide is a comprehensive tour of the main Call Detail Record (CDR) interface in the VoIPmonitor GUI. It explains every section, button, and feature, from searching for calls to analyzing their quality in detail.
What is a CDR?
A Call Detail Record (CDR) is a data record containing information about a single telephone call or communication session. In VoIPmonitor, each CDR captures:
- Call timing (start time, duration, connect time)
- Participant information (caller/called numbers, IP addresses, SIP agents)
- Signaling details (SIP messages, final response codes)
- Quality metrics (MOS scores, packet loss, jitter/delay statistics)
- Media information (codecs, RTP stream data)
The CDR view is the primary interface for searching, filtering, and analyzing these records.
How CDR Fields Are Populated
VoIPmonitor populates CDR fields directly from the SIP INVITE packet. The values recorded are a direct reflection of the data in these SIP headers.
- Calling Number: Taken from the
Fromheader of the SIP INVITE.
- Called Number: Taken from the Request-
URIof the SIP INVITE. If the number is not in the URI, theToheader is used instead.
- Caller IP (sipcallerip): The source IP address of the SIP INVITE packet.
- Called IP (sipcalledip): The destination IP address of the SIP INVITE packet.
Configuring Destination Number Source
By default, VoIPmonitor stores the called number from the SIP Request-URI. You can change this behavior using the destination_number_mode parameter in voipmonitor.conf:
destination_number_mode = 1(default) - Take called number from theToheader.
destination_number_mode = 2- Take called number from the INVITE Request-URI.
This is particularly useful when:
- Your SIP requests use full SIP URIs (e.g.,
sip:john.macasaet@company.com) in the Request-URI but display names in theToheader - You need to search calls by the URI user part rather than a display name
- The
Toheader contains different information than what appears in the actual destination
To change this setting, edit /etc/voipmonitor.conf, add or modify the destination_number_mode parameter, and restart the VoIPmonitor service:
systemctl restart voipmonitor
If caller/called numbers or IP addresses appear "inverted" in your CDRs, this typically indicates that the SIP signaling flow in your network is different than expected (for example, the PBX may be initiating a callback). The values are correct as recorded - they simply reflect what is present in the actual SIP headers.
To verify the field mapping, use the SIP History tab in the CDR detail view to inspect the actual SIP INVITE packet and compare the From, To, and URI fields with the CDR columns.
Understanding the Main CDR View
The CDR view is the central hub for exploring your captured call data. It is comprised of three main sections:
- The CDR List: The main table displaying a paginated list of all finished calls.
- The Button Panel: A toolbar for accessing key functions like filtering, charting, and exporting.
- The Dashboard: A set of panels at the bottom that provide aggregated statistics for the currently displayed data.


The CDR List
This section details the components of the main call list, from the title bar to the information in each row.
Title Bar & Date Filter
At the very top, the title bar displays the current time range for the calls being shown. You can click on the dates to quickly change the filter.
Timezone Display Setting
In the top right corner of the CDR view, there is a timezone selector that controls how call timestamps are displayed. This setting is user-specific and can shift the displayed time based on your local browser/OS settings, independent of how the data is stored in the database.
Understanding the timezone hierarchy:
- Storage Layer (Sniffer): Controlled by
utcandtimezoneoptions invoipmonitor.conf(see Sniffer Configuration) - GUI Layer (Settings): Controlled by Settings > System Configuration > National > Timezone
- Display Layer (CDR View): Controlled by the timezone selector in the top right corner (user-specific)
If CDR times appear incorrect, check all three layers in the order listed above.
Note: This quick date filter can be disabled on a per-user basis in user settings.
![]()
Button Panel
This toolbar provides access to the most important interactive features.
![]()
Understanding the Last SIP Response
The "Last SIP Response" column in the CDR list displays the final SIP response code captured by VoIPmonitor. It is important to understand that this response may not always correspond to the initial INVITE's response.
⚠️ Warning: If the "Last SIP Response" column is empty and the "Last SIP Response Code" filter returns no results, you must configure the sniffer to store SIP responses. See Searching SIP Response Text for configuration steps.
Why You Might See Different Response Codes
It is possible for a single call to display multiple response codes in different contexts:
200 OK and 5XX/4XX in the Same Call:
- If the Duration > 0 (call has media): The call WAS successfully connected. The 200 OK indicates successful session establishment. Any later error response (e.g., 503 Service Unavailable) appears in the signaling after the call was connected, typically in a BYE packet's Reason header indicating why the call was terminated.
- If the Duration = 0 (no media): The call was NOT connected. Multiple signaling responses occurred before session establishment, such as multiple SIP forking legs where one destination answered while another failed.
Finding the Termination Reason
To understand why a call shows a specific response code (especially 5XX or 4XX codes in the "Last SIP Response" column):
- Locate the call in the CDR list and click the
[+]icon to expand the detail view - Navigate to the SIP History tab
- Find the BYE packet (this is the message that terminates the call)
- Click the magnifying glass icon on the BYE packet row to expand the packet details
- Look for the Reason header in the packet detail tree
The Reason header in the BYE packet contains the SIP response code describing why the call was terminated. For example:
Reason: SIP; cause=503; text="Service Unavailable"
This status may indicate:
- A specific action taken by the called party (e.g., DTMF choice in an IVR system)
- A downstream issue in an SBC or SIP proxy
- Device availability or routing problems
Filter Form
This is the most powerful feature for finding specific calls. Clicking this button opens a detailed search form with two main tabs.
Common Tab
This tab contains filters for general call attributes and participant information.

- Participant Filters: Search by
Caller/Called Number,Caller/Called IP, orCaller/Called Domain. You can use the%character as a wildcard (e.g.,222%finds all numbers starting with 222). You can also use commas for multiple values and!for negation (e.g.,222%, !223%).
Filtering by Email-formatted SIP Addresses
When SIP addresses use email format (e.g., anonymous@anonymous.invalid), use both the Number and Domain fields together:
Example: Finding calls with From header "anonymous@anonymous.invalid"
- Click the Filter Form button and go to the Common tab
- In the caller field (under Caller/Called Number), enter the user part:
anonymous - In the caller field (under Caller/Called Domain), enter the domain part:
anonymous.invalid - Click Apply filter
This approach works for any SIP address formatted as user@domain, which is common for anonymous callers, special service numbers, or SIP URIs with domain information.
Regular Expressions for Advanced Number Filtering
The CDR number filters support regular expressions using the R() syntax. This is useful for complex patterns and searching for number ranges.
Basic Regex Examples
Find numbers matching a specific pattern:
R(^500[0-9]{4}$)
Matches exactly 9-digit numbers starting with 500.
Find numbers without digits only (malformed):
!R(^[+]?[0-9]+$)
Negative match to find calls with non-numeric characters in the caller number.
Searching for Number Ranges
To search for a numeric range (e.g., from 171457872 to 171457879), use regex character classes:
R(17145787[2-9]) R(1714578[89])
The space between the two R() patterns acts as OR logic, matching either pattern. This covers all numbers in the range 171457872 through 171457879.
Other Range Examples
Match specific last digits (e.g., 100 through 109):
R(0?1[0]{2}[0-9])
Match numbers ending in specific ranges:
R([0-9]{3}[0-4][0-9])
Match numbers ending in 04X through 09X.
How to Find and Download Audio for Partial Caller + Specific Called Numbers
This workflow allows you to search for calls using a partial match on the calling number (A number) combined with a specific or partial called number (B number), then batch download all the audio files.
Step-by-step procedure:
- Navigate to the GUI CDR view
- Click the Filter Form button
- In the Common tab, find the Caller/Called Number filter section
- In the caller field, enter the partial number with a
%wildcard:
%123456matches all numbers ending in 123456123%matches all numbers starting with 123
- In the called field, enter the called number (with wildcard if needed):
99999for an exact match999%for a partial match
- Click Apply filter - the view now displays all CDRs matching both criteria
- Click the Menu button
- Select Batch download audio - this downloads audio files (WAV/OGG) for all currently displayed CDRs
- Note: Batch download is limited to 100 records at a time for performance reasons
Example: To download audio for all calls from a specific prefix to a particular destination:
- Caller:
123%(finds all callers starting with 123) - Called:
555(finds exact called number 555)
- Group Filters: Search by pre-defined
Caller/Called GroupsorIP Groups. - IP Address Include Proxy: When filtering by
Caller IPorCalled IP, check the IP Address Include proxy checkbox to include proxy IP addresses from the proxy chain (tracked viacdrproxysetting). This prevents calls with different SIP source and destination IPs from being incorrectly merged in the view. This is particularly useful when:- Calls are routed through multiple SIP proxies where the signaling IP changes at each hop
- You need to see the full proxy chain for a call
- CDRs appear incorrectly merged with different participants but same Call-ID or correlation header
- Disable the checkbox to filter only by the direct SIP source/destination IPs (ignoring proxy chain).
- Call Attribute Filters: Filter by
Call Duration,Codec, orPDD(Post-Dial Delay) ranges. - SIP Filters: Filter by
Last SIP Response Code(e.g.,487, or4%for all 4xx codes),SIP Agent(phone type/firmware),SIP Call-ID,SIP responses(full SIP response text for custom text filtering), orSIP requests(select a specific SIP method such as INVITE, REFER, BYE, CANCEL, etc.). The SIP requests filter also supports counting occurrences - for example, to find calls with multiple SIP INVITEs (indicating multiple connections or re-INVITEs), set the filter tosip requests: INVITE count >= 3. This allows you to identify calls with complex signaling patterns directly from the CDR list without opening each call. Note: The "SIP requests" dropdown filter requiressave_sip_history = allorsave_sip_history = requeststo be configured in voipmonitor.conf. The "SIP responses" filter requiressave_sip_history = responsesorsave_sip_responses = yesto be enabled.
Finding re-INVITE Calls
A re-INVITE is an INVITE request sent during an established call to modify the session parameters (e.g., changing IP address, codec, or placing on hold). Re-INVITEs are identified by the presence of a tag in the To header. VoIPmonitor provides two methods to filter for re-INVITE calls:
Method 1: Using SIP Requests Count (recommended for general use)
Use the SIP requests filter in the Common tab to find calls with multiple INVITEs:
- Open Filter Form -> Common tab
- In the
SIP requestsdropdown, select:INVITE - Set count to
>= 3(or>= 2for simpler cases)
This identifies calls where the system recorded multiple INVITE messages, which may indicate re-INVITEs, re-authentication attempts, or call transfers. This method does not require additional configuration beyond save_sip_history.
Method 2: Using Custom Headers toTag (more precise)
For more precise detection of re-INVITEs specifically, you can configure CDR Custom Headers to capture the To header tag and filter based on its presence:
- Configure CDR Custom Headers in Settings -> CDR Custom Headers to capture the
Toheader from INVITE packets. See CDR Custom Headers for configuration details. - Generate new test calls after configuring custom headers (the configuration only applies to new CDRs created after the setting is saved).
- In the CDR view, use the
ToTagfilter with:
%to find calls where the tag is present (indicating a re-INVITE)NULLto find calls where the tag is absent (no re-INVITE)
This method is more specific as it directly checks for the presence of the to-tag in the To header, which is the definitive indicator of a re-INVITE according to the SIP protocol specification. However, it requires custom header configuration and only works for calls captured after the configuration is set.
- Other Filters: You can also filter by the
Sensorthat captured the call or find allInterruptedcalls (those without a proper BYE).
Enabling SIP History
To use the SIP requests filter and to view SIP message details in the CDR detail view, you must enable SIP history capture on the sensor. This feature records SIP signaling details including the number of requests per call (e.g., multiple INVITEs for detecting retransmissions).
Configuration Steps:
- Edit the
voipmonitor.confconfiguration file on the sensor - Add or modify the
save_sip_historyoption:
- Use
save_sip_history = allto capture both SIP requests and responses - Use
save_sip_history = requeststo capture only SIP requests (lighter on database) - Use
save_sip_history = requests,responsesto capture requests and responses explicitly
- Use
- Restart the sensor service to apply the configuration change
After enabling SIP history:
- The
SIP requestsdropdown filter will show the number of SIP messages per call - You can filter for calls with excessive INVITEs (e.g.,
>= 3) to detect SIP retransmissions - The SIP History tab in CDR detail view will display complete SIP message flows
- The SIP requests count will appear in the CDR list column (if enabled in column visibility settings)
Important Notes:
- Only CDRs created after enabling
save_sip_historywill contain SIP request counts - Existing CDRs will not be retroactively populated with SIP history data
- Choose
save_sip_history = requestsoverallin high-traffic deployments to reduce database overhead
Searching SIP Response Text
The SIP responses filter allows you to search for custom text within SIP response headers. This is useful when you need to find calls with specific response messages such as "Service Unavailable", "User Busy", or any custom rejection reasons.
⚠️ Warning: Both the "Last SIP Response Code" filter and the "SIP responses" filter require SIP responses storage to be enabled on the sniffer. Without this configuration, these filters will return no results.
Unlike the standard "Last SIP Response Code" filter which only searches for numeric response codes (e.g., 503, 404), the SIP responses filter searches the full text content of SIP response messages.
When to use SIP responses filtering:
- Find all calls with "Service Unavailable" in the response text
- Identify calls rejected with specific SBC error messages
- Search for custom SIP response reasons not captured by response codes
- Filter calls based on rejection reasons in BYE packet responses
Enabling SIP Responses Storage:
To use the SIP responses filter, you must enable SIP responses storage on the sensor. This feature captures the full text of SIP response messages so they can be searched in the CDR filter.
Configuration Steps:
- Edit the
voipmonitor.confconfiguration file on the sensor - Add one of the following options:
- Use
save_sip_history = responsesto store SIP response text - Use
save_sip_responses = yesas an alternative option - You can also use
save_sip_history = allwhich includes responses
- Use
- Restart the VoIPmonitor service to apply the configuration change
systemctl restart voipmonitor
Using the SIP Responses Filter:
- Navigate to the CDR view and click Filter Form
- In the Common tab, locate the SIP responses filter field
- Enter the custom text you are searching for (e.g., "Service Unavailable", "User Busy")
- Click Apply filter
The filter will return all calls that contain the specified text in their SIP response headers. You can use wildcards and partial matches to find variations of response text.
Important Notes:
- Only CDRs created after enabling SIP responses storage will contain searchable response text
- Existing CDRs will not be retroactively populated with SIP response data
- Enabling SIP responses storage increases database storage requirements slightly
- The filter searches the full SIP response message, not just the Reason header in BYE packets
Detecting SIP Retransmissions
SIP retransmissions occur when endpoints send duplicate SIP requests (e.g., INVITE, REGISTER) due to network latency or unresponsive servers. Common causes include:
- Network issues causing delayed or lost responses
- Unresponsive SIP servers or PBXs
- High latency paths exceeding SIP transaction timers
VoIPmonitor provides two main ways to detect retransmissions:
1. CDR Filter Method (recommended for identifying affected calls)
- Navigate to the CDR view and click Filter Form
- In the Common tab, locate the
SIP requestsdropdown - Select
INVITE - Set the count operator to
>=and enter3 - This filters for calls with 3 or more INVITEs, which typically indicates multiple INVITE attempts and possible retransmissions
2. SIP History Tab (for detailed analysis)
- Click on a suspicious call to open the CDR detail view
- Navigate to the SIP History tab
- Examine the sequence diagram or message table for repeated INVITEs with identical Call-ID and CSeq values
- Retransmissions appear as vertically stacked identical messages with slightly different timestamps
Note: The SIP REGISTER RRD beta alert type in Alerts can also be used to monitor registration response times, which serves as an indirect indicator of potential REGISTER retransmissions.
RTP Tab
This tab allows you to find calls based on specific Quality of Service (QoS) metrics. This is essential for troubleshooting audio quality issues.

- RTCP Metrics: Filter by
JitterorFraction Lossvalues reported by the endpoints themselves via RTCP. - MOS: Find all calls with a Mean Opinion Score lower than a specified value.
- PDV (Jitter): Find calls with a specific number of Packet Delay Variation events in different time intervals (e.g., find all calls with at least 10 packets delayed by more than 120ms).
- Loss: Find calls based on patterns of consecutive packet loss.
- Silence & Clipping: If enabled on the sensor, you can find calls with a certain percentage of silence or a specific number of clipped audio frames. See Silence_detection for configuration details.
- Last RTP from Last SIP (caller/called): Find calls where the RTP stream ended before the final SIP packet. This filter is useful for identifying calls with early media stops, one-way audio failures, or calls put on hold where music-on-hold stopped. The filter compares the time when RTP packets stopped flowing to the time of the last SIP signaling packet, returning calls where the media stream terminated prematurely.
Quick Filters
This dropdown provides shortcuts for finding problematic calls (e.g., "Worst Calls by Loss") and gives you access to your saved filter templates.

Saving and Reusing Filter Templates
You can save frequently-used filter criteria as templates and reapply them later, or combine multiple templates using OR logic.
To save a filter template:
- Apply your desired filter criteria using the Filter Form.
- Click the Save filter template button (usually shown as a save/disk icon in the filter area).
- Enter a descriptive name for your template (e.g., "Calls dropped within 5 seconds").
- The template will appear in the Quick Filters dropdown menu for future use.
To apply a saved filter template:
- Click the Quick Filters dropdown.
- Select your saved template from the list.
Combining Multiple Templates (OR Logic)
When you need to find calls matching multiple different criteria at once (for example, all types of call setup failures), use the Combination subtab within the filter form to merge templates using logical OR.
To combine multiple filter templates:
- Create and save separate templates for each type of filter you need (e.g., one for "Missing BYE", one for "Short calls", one for "5xx responses").
- Open the Filter Form and navigate to the Combination subtab.
- Select all the templates you want to merge.
- The system will return all calls matching ANY of the selected templates (OR logic).
Example use case: Finding all call setup failures:
- Save template 1: "Interrupted calls" (missing BYE).
- Save template 2: "Short duration (0-5 seconds)" (calls answered then dropped).
- Save template 3: "5xx SIP responses" (server errors).
- Use the Combination subtab to select all three templates.
- Result: One unified CDR view showing all calls with ANY of these failure types.
Menu
This menu contains administrative actions.
- Delete: Delete selected CDRs and their associated files (PCAPs, audio).
- Export CSV: Export the current view of CDRs to a CSV file.
- Batch download audio: Download audio files for all currently displayed CDRs. This feature allows you to bulk export audio recordings (WAV, OGG, or other formats) based on your current filter criteria. The download is limited to 100 records at a time for performance reasons.

Selecting Multiple CDR Rows
To select multiple CDRs for Delete, Export CSV, or Batch download audio operations, use standard keyboard/mouse combinations on the CDR checkboxes:
- Non-contiguous selection (pick specific rows): Hold down the
CTRLkey (orCommandon Mac) while clicking on the checkboxes for the desired rows.
- Contiguous selection (range of rows): Click the checkbox of the first row, hold down the
SHIFTkey, and click the checkbox of the last row in the desired range.
Once multiple rows are selected (checked), click the Menu button and choose Delete, Export CSV, or Batch download audio. The operation will apply only to the selected rows, not to all currently displayed CDRs.
Note: The CTRL and SHIFT key combinations work for all three Menu actions, not just Delete. If checkboxes are selected, the export operations will process only the checked rows.
Charts
This button opens a window for adding overlay charts to your current CDR view, allowing you to correlate data visually. This feature is covered in detail in the Charts guide.

CDR List Columns
Each column in the CDR list provides key information and can be used for quick sorting.

Customizing Column Visibility
You can show or hide columns in the CDR list based on your preferences. This is useful when:
- You want to reduce visual clutter and focus on specific information
- Certain columns contain data that is causing performance issues
- Your display has limited screen space
To hide or show columns in the CDR view:
- Locate the column header area at the top of the table
- Click on the column visibility icon (typically a column or grid icon)
- Uncheck columns you want to hide, check columns you want to show
- The view will update immediately with your selection
Your column visibility preferences are stored in the GUI configuration (saved in the MySQL custom_config table) and persist across sessions.
Column Reference
A single row represents a single call.

| Column | Description |
|---|---|
| ID | The unique identifier for the call record (primary key in the database) |
| Sensor ID | The name of the sensor that captured the call (see Sensors configuration) |
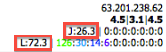
| Datetime | The start time of the call (from first INVITE) |
| Duration (PDD) / Codec | Total call duration, Post-Dial Delay, and the audio codec used |
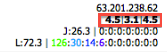
| Caller/Called Info | Number, Name, SIP IP, and SIP Agent. The red flag |
| Last Response | The final SIP response code and text for the call |
| RTP IP Addresses | Source IP addresses for the caller and callee RTP streams |
Quality Metric Columns
The quality columns provide at-a-glance indicators of call quality:
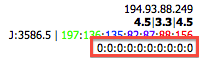
- MOS Column
 : Shows three parametric MOS scores based on different jitter buffer simulations:
- F1: Fixed 50ms jitter buffer
- F2: Fixed 200ms jitter buffer
- Adapt: Adaptive jitter buffer (up to 500ms)

- Delay Column
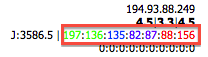 : Color-coded distribution of packet delay variation (jitter) events. See Jitter Analysis for interpretation.

- Loss Column
 : Color-coded distribution of consecutive packet loss events. Red indicates burst losses which are more harmful to quality.

- RTCP Column
 : Maximum jitter and fraction loss as reported by the endpoints themselves via RTCP.

- PRICE Column: Shows billing costs calculated by the billing system. This column is hidden by default and must be enabled manually. To enable the PRICE column:
- Click the dropdown menu on the first column (the column header with the ID or the column selection icon)
- Select PRICE from the list of available columns
- The PRICE column will now display Customer (C:) and Operator (O:) prices for each call
Note: Costs only appear if billing is configured (see Billing Configuration) and "Enable by addresses" or "Enable by numbers" is checked in the billing settings. The "Default customer billing" checkbox ensures customer prices are applied to all source IPs by default, which may be useful for reporting purposes.
Understanding Sniffer vs RTCP Packet Loss
VoIPmonitor provides two different packet loss metrics measured from different network locations:

Interpretation Guide:
| Scenario | Likely Cause |
|---|---|
| RTCP loss > Sniffer loss | Network issue after the sniffer (Wi-Fi, last-mile, endpoint network) |
| Sniffer loss > RTCP loss | Monitoring point dropping packets (CPU overload, interface saturation) or RTCP reports not captured |
| High RTCP loss, good MOS | Packet Loss Concealment (PLC) effectively hiding scattered losses |
Troubleshooting tips:
- Trust RTCP loss for user experience issues - it reflects what the device actually received
- Use sniffer loss for network health monitoring in the segment you control
- When RTCP loss is higher, investigate the network path between sniffer and endpoint
Commands Column
The Commands column  contains:
- Download links for PCAP and WAV files
- Embedded audio player to listen directly in the browser
The CDR Detail View
Clicking the [+] icon at the beginning of any CDR row expands it to show the detailed analysis view with multiple tabs.

Summary Tab
This tab provides a detailed breakdown of call information, RTP statistics, and a full chronological log of all SIP messages for the call.

The Call Quality Graph
The most prominent feature is the detailed quality graph, which plots packet delay and loss over the duration of the call.

- Each vertical line represents a group of packets
- The colored dot represents the median delay (jitter)
- Packet loss is shown as red lines at the top of the graph
- Clock Drift: A graph that steadily climbs or descends
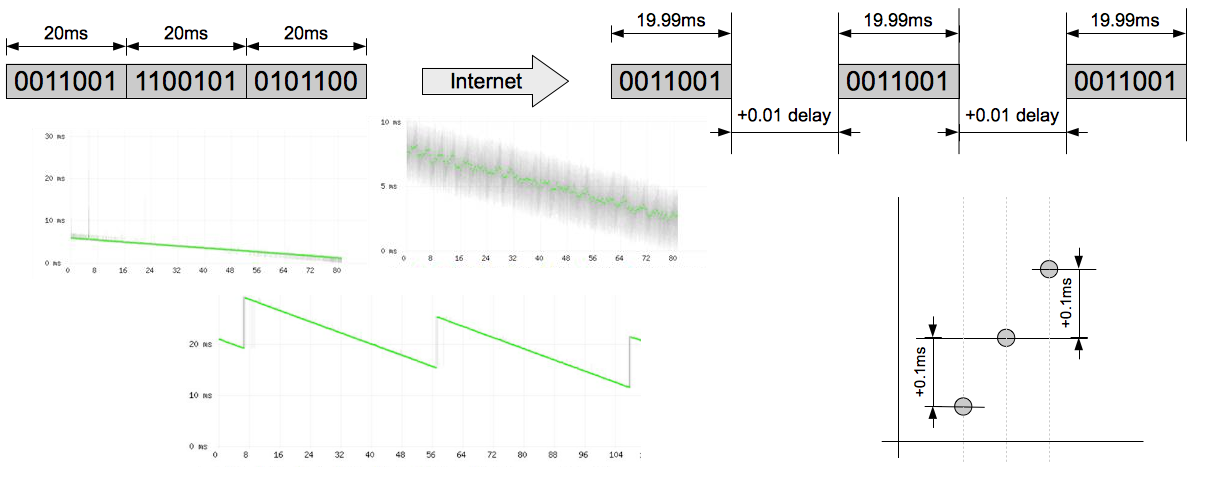 indicates a clock drift issue between the sending device and the sensor, not necessarily a network problem

How Delay Causes Packet Loss (Jitter Buffer Behavior)
The graph plots delay (median delay/jitter), not constant one-way latency. This distinction is important because large delays directly cause packet loss in real-world calls.
Here is what happens when you see increasing delay on the graph:
1. RTP packets normally arrive every 20ms (for standard codecs) 2. When the delay increases (the dot moves higher), packets are arriving later than expected 3. The receiving device uses a jitter buffer to smooth out these variations 4. If a packet arrives too late (exceeding the jitter buffer capacity, typically 50-200ms depending on the device), it gets skipped during audio playback 5. VoIPmonitor detects this as missing sequence numbers and reports it as packet loss
This is why you will often see patterns where: high delay regions on the graph correlate with red packet loss lines appearing nearby. The delay itself is not a quality issue per se, but when it becomes too large, packets get dropped because they cannot be played in time.
For detailed information on how jitter buffers work and how delay patterns affect MOS scores, see Jitter Buffer Simulation.
Received Packets (Caller / Called)
The "received packets" field in the CDR grid shows how many RTP packets the VoIPmonitor sniffer received FROM that endpoint, not how many packets the endpoint itself received.
| Field | Meaning |
|---|---|
| Caller → Received Packets | Number of RTP packets VoIPmonitor received from the caller (A-leg) |
| Called → Received Packets | Number of RTP packets VoIPmonitor received from the called party (B-leg) |
One-Way Stream Example: If you have a unidirectional RTP stream (caller → called only):
- Caller column shows: 73 packets (VoIPmonitor received 73 packets from the caller's stream)
- Called column shows: empty (VoIPmonitor received no packets from the called party)
This indicates that VoIPmonitor sniffed packets sent by the caller, but did not capture any return stream from the called party.
Bidirectional Stream: Both columns will have values when VoIPmonitor receives RTP packets from both endpoints.
DTMF Section
When DTMF capture is enabled on the sensor, the Summary tab displays a dedicated **DTMF section** that shows all DTMF digits pressed during the call.
To enable DTMF capture, configure voipmonitor.conf:
- For SIP INFO and RTP RFC 2833 methods, set:
dtmf2db = yes - For in-band DTMF (G.711 codec only, CPU intensive), set:
inbanddtmf = yes
Once enabled, the DTMF digits are stored in the database and appear in this section, along with being viewable in the SIP History tab (for INFO messages) or in dedicated DTMF charts/tables for RFC2833 events. See the FAQ for more DTMF configuration details.
RTP Stream Used in Another Call Warning
If you see the message "RTP Stream used in another call" in the Summary tab, this is an informational notification, not an error.
What this means: This message indicates that the IP address and port combination used for the RTP stream in the current call matches another CDR in the system. The RTP stream was identified as being shared or reused across multiple call sessions. This typically occurs when:
- A PBX aggressively reuses UDP ports for RTP traffic between subsequent calls before the previous session's RTP logic has timed out in VoIPmonitor
- Complex NAT scenarios where RTP paths overlap
- Specific network topologies with multiple SIP trunks or proxies
Is it an error? No, this is not a system error or malfunction. It is a warning that the RTP stream was "shared" between calls, which means the quality graph for this CDR might include data from a different call, or the stream is mixed across sessions.
How to investigate:
To find other CDRs using the same RTP stream:
- Use the CDR view filter under the RTP subtab to find calls with matching IP:port combinations
- Alternatively, click the warning message in the CDR detail's SIP History view to see related calls
SIP History Tab
This tab provides a powerful, Wireshark-like view of the call's signaling.
- Sequence Diagram: A visual representation of the SIP message flow between endpoints
- Message Table: A text-based list of all SIP messages and RTP streams
- Packet Detail: Clicking on any message opens a window with a fully decoded tree view of the packet, similar to Wireshark


Legs by CID / Legs by Header Tabs
These tabs are used to find related call legs in complex call scenarios. For detailed information about call correlation, see Merging_or_correlating_multiple_call_legs.
- Legs by CID: Finds other calls that share the same numeric part of the
Fromheader tag within a few seconds of the original call. This is useful for finding the other legs of a call that was routed through a PBX.
- Legs by Header: A more powerful method that correlates calls based on a shared identifier in a custom SIP header (configured by
match_headerinvoipmonitor.conf). This is essential for tracing a single call across multiple proxies or SBCs where the Call-ID changes at each hop.
Charts Tab
This tab displays a set of predefined and custom charts applied specifically to the context of the selected call (e.g., showing trends for the caller number). This allows for quick historical analysis without leaving the CDR view.

Map Tab
This tab attempts to geolocate the source and destination SIP IP addresses on a world map using a GeoIP service.

The Dashboard Panels
The panels at the bottom of the screen provide aggregated views of the data currently displayed in the CDR list.

- Group By: You can group the data by
Last SIP Response,Codec,SIP IP, or predefinedIP Groups - Charts: The middle section displays a pie chart of the grouped data
- Filters: Clicking on any item in the group grid (e.g., clicking on the "200 OK" response) will instantly apply it as a filter to the main CDR list above
Trend Analysis for Capacity Planning
The grouping tab supports trend analysis that helps with capacity planning. When you group by source or destination IP (SIP IP) or predefined IP Groups, you can:
- View Trends by Source/Destination IP: Navigate to the Grouping tab at the bottom of the CDR view and select "SIP IP" as the grouping option. This allows you to visualize call volume trends for specific source or destination IP addresses over time.
- Capacity Planning Use Case: By analyzing trends grouped by IP address, you can identify high-traffic sources or destinations that may require scaling. This is particularly useful for:
- Planning additional bandwidth for SIP trunks
- Identifying growth patterns for customer traffic
- Forecasting hardware needs based on IP address trends
- CDR Trend Alerts: In addition to viewing trend data interactively, you can configure alerts to trigger automatically based on CDR trends. See Alerts for information on setting up trend-based alerts for proactive capacity planning.
Limitations & Known Issues
Media Encryption (SRTP, DTLS, ZRTP) Filtering
VoIPmonitor captures and can decrypt SRTP and DTLS (see TLS/SRTP Decryption Guide for decryption configuration), but there is no filter for media encryption protocols (SRTP, DTLS, ZRTP) in the CDR view.
| Encryption Type | Support | How to Verify |
|---|---|---|
| Supported (can decrypt if configured) | Manual verification via SIP History tab | ||
| NOT supported | Cannot monitor ZRTP-encrypted calls |
How to Manually Verify SRTP/DTLS Usage:
If you need to verify whether a specific call used SRTP or DTLS encryption, you must inspect the SDP content in the SIP signaling:
- Click on a CDR row to expand the detail view
- Navigate to the SIP History tab
- Click on the SIP INVITE packet
- Expand the SDP section and look for:
a=cryptolines - indicate SRTP encryptiona=fingerprintanda=setupattributes - indicate DTLS-SRTP negotiation
⚠️ Warning: ZRTP is NOT Supported: VoIPmonitor does not currently support monitoring or decrypting ZRTP-encrypted calls. Calls using ZRTP will appear as encrypted/unclear media stream in the GUI, and their details cannot be inspected.
Related Documentation
- Database_structure - Technical reference for CDR database columns
- Comprehensive_Guide_to_VoIP_Voice_Quality - In-depth guide to MOS, jitter, and quality metrics
- Merging_or_correlating_multiple_call_legs - How to correlate call legs across systems
- Silence_detection - Audio analysis features (silence/clipping detection)
- Reports - Generating reports from CDR data
AI Summary for RAG
Summary: The CDR (Call Detail Record) View is the primary interface in VoIPmonitor GUI for analyzing captured calls. It consists of three main sections: CDR List (paginated call records), Button Panel (filtering and export tools), and Dashboard (aggregated statistics). The Filter Form provides search capabilities through Common tab (participant info, duration, SIP filters with % wildcard for partial matching) and RTP tab (quality metrics like MOS, jitter, packet loss). Menu button provides Delete, Export CSV, and Batch download audio (limited to 100 records). Each CDR row displays call timing, participant information, and quality metrics including three MOS scores (F1, F2, Adaptive). The RTCP column shows endpoint-reported metrics; when RTCP loss is higher than sniffer loss, it indicates network issues after the monitoring point. The Detail View includes Summary tab with quality graphs and DTMF section (enable with dtmf2db/inbanddtmf in voipmonitor.conf), SIP History tab with Wireshark-like packet analysis, and Legs by CID/Header tabs for correlating related call segments. For SIP retransmissions detection: enable save_sip_history in voipmonitor.conf, then filter for INVITE count >= 3. The RTP tab includes "Last RTP from Last SIP" filter for finding calls with early media stops. To filter calls with email-formatted SIP addresses (e.g., anonymous@anonymous.invalid): use Filter Form Common tab, enter user part in "Caller/Called Number" field (e.g., "anonymous") and domain part in "Caller/Called Domain" field (e.g., "anonymous.invalid"). LIMITATION: No filter for media encryption (SRTP, DTLS, ZRTP) - verify manually via SDP in SIP History tab. ZRTP is NOT supported. To search SIP response text, enable save_sip_history = responses or save_sip_responses = yes. To find call termination reason, inspect the Reason header in the BYE packet via SIP History tab.
Keywords: CDR, call detail record, GUI, filter, search, MOS, jitter, PDV, packet loss, quality metrics, SIP history, sequence diagram, call legs, correlation, dashboard, RTCP, sniffer loss, trend analysis, SIP requests filter, INVITE count, re-INVITE, filter template, batch download audio, wildcard, DTMF, dtmf2db, save_sip_history, SIP retransmissions, Last RTP from Last SIP, early media stops, one-way audio, SRTP, DTLS, ZRTP, encryption, SIP responses filter, BYE packet, Reason header, termination reason, multiple selection, CTRL, SHIFT, email-formatted SIP addresses, Anonymous @ anonymous.invalid, Caller/Called Domain, Caller/Called Number filtering
Key Questions:
- How do I use the CDR view to find specific calls?
- How can I filter calls by quality metrics (MOS, jitter, loss)?
- What do the MOS F1, F2, and Adaptive scores mean?
- How do I view the SIP message flow for a call?
- What is the difference between Legs by CID and Legs by Header?
- What is the difference between sniffer loss and RTCP loss?
- How do I detect SIP retransmissions using the CDR view?
- How do I enable SIP history capture in voipmonitor.conf?
- Where can I view DTMF digits pressed during a call?
- How do I filter calls by media encryption (SRTP, DTLS, ZRTP)?
- Does VoIPmonitor support ZRTP encryption monitoring?
- How do I find calls where the RTP stream ended before the final SIP packet?
- Why does my call show both 200 OK and 503 Service Unavailable?
- How do I find the termination reason in the CDR view?
- How do I search for custom text within SIP response headers?
- How do I select multiple CDR rows for batch operations?
- How do I use the Batch download audio feature?
- How do I filter CDRs where the From header is anonymous@anonymous.invalid?
- How do I use Caller/Called Number and Caller/Called Domain fields together?