Redundant database
This page describes the Active Calls view, which provides real-time monitoring of ongoing calls in the VoIPmonitor GUI.
Overview
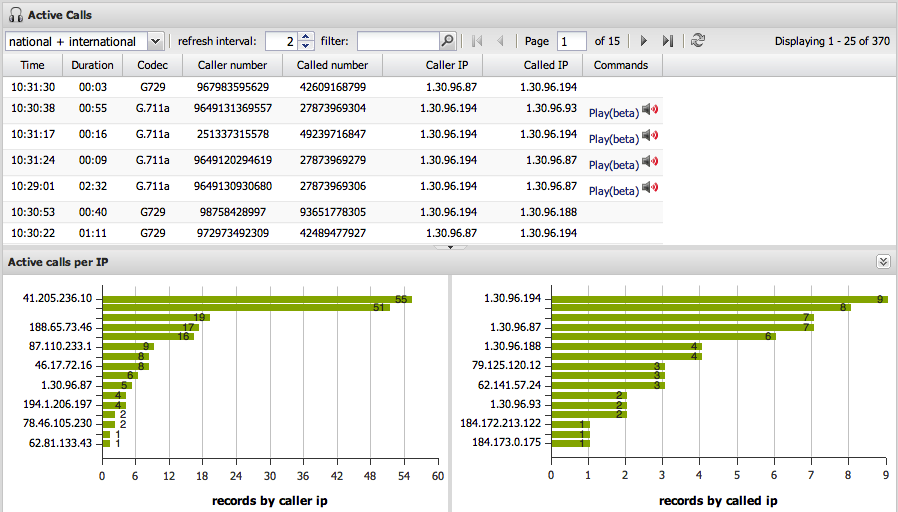
The Active Calls view displays current calls in real time and allows you to listen to G.711 calls live (requires sniffer version 7 or newer). The view refreshes automatically according to the configured refresh interval (default: 2 seconds).
Communication with Sniffer
Live call data is fetched from the VoIPmonitor sniffer instance through the manager TCP port 5029. If calls are not displayed, verify that the web server can reach this port:
telnet localhost 5029
Direct URL Access
You can open the Active Calls view directly using this URL format:
http://your-server/admin.php?activecalls=1
Filtering Calls
The filter box adapts to the type of input provided. Calls can be filtered by:
- National or international (via combo box)
- Sensor
- IP address or IP prefix
- Phone number or prefix
- Call-ID
Filter Syntax Examples
| Input | Description |
|---|---|
192.168.% |
Filters calls with source or destination IP starting with 192.168.x.x |
00 |
Filters calls where the number starts with 00 |
abc123 |
Searches for exact Call-ID match |
%abc123% |
Searches for Call-ID containing "abc123" (substring match) |
Note: By default, Call-ID search matches the full Call-ID string. To search for a substring, add the % wildcard character to the start and/or end of the search string.
Bottom Graphs
The bottom section of the Active Calls view displays graphs showing the top callers grouped by:
- Caller IP address
- Called IP address
Customizing Column Visibility
The Active Calls view allows you to show or hide columns based on your preferences. This is useful when:
- You want to reduce visual clutter and focus on specific information
- Certain columns contain data that is causing performance issues (e.g., parsing errors in the Proxy column)
- Your display has limited screen space
To hide or show columns:
- Locate the column header area at the top of the table
- Click on the column visibility icon (typically a column or grid icon) or look for a "Show columns" dropdown menu
- Uncheck columns you want to hide, check columns you want to show
- The view will update immediately with your selection
Your column visibility preferences are stored in the GUI configuration (saved in the MySQL custom_config table) and persist across sessions.
Troubleshooting Performance Issues
If the Active Calls view becomes unresponsive or slow, particularly when displaying certain columns like "Proxy":
- Temporary workaround
- Hide the problematic column using the column visibility method above.
- If the GUI is completely unresponsive
-
- Connect directly to the GUI database
- Check the
custom_configtable for column visibility settings - Clear or modify the relevant configuration entries
- Contact support with SSH access to the GUI host for investigation
- Information to provide for support
-
- A SIP PCAP dump of a problematic call (to identify data causing parsing errors)
- A mysqldump of the
voipmonitor.custom_configtable (to review current column configuration)
Programmatic Access to Active Calls
In addition to viewing active calls in the GUI, you can programmatically retrieve active call data for automation and integration purposes.
GUI API (Recommended for Centralized Systems)
The VoIPmonitor GUI provides a web API endpoint listActiveCalls that retrieves active calls from all connected sensors/probes. This is the preferred method for centralized monitoring environments.
- Method:* HTTP POST or GET to
/php/api.php?task=listActiveCalls - Documentation:* WEB_API#listActiveCalls
Example:
curl -X POST 'http://yourserver/php/api.php?task=listActiveCalls&user=USER&password=PASSWORD¶ms={"sensorId":"1"}'
Sniffer Manager API (For Individual Sensors)
For direct access to a single sensor instance, use the sniffer service's manager API on port 5029. The listcalls command retrieves active call data from the specific sensor.
- Method:* TCP connection to port 5029
- Documentation:* Manager API
Example:
echo 'listcalls' | nc localhost 5029
The manager API supports filtering by caller number, called number, IP addresses, and other criteria. See the Manager API documentation for advanced filtering examples.
Choosing the Right Method
- Use the GUI
listActiveCallsAPI when:* - You have multiple sensors/probes and need centralized access
- You want to query all connected sensors from a single endpoint
- You are building external integrations that need filtered results
- Use the sniffer manager API when:*
- You need direct access to a specific sensor instance
- You are running scripts locally on the sensor host
- You require low-latency queries without GUI involvement
AI Summary for RAG
Summary: Active Calls provides real-time monitoring of ongoing VoIP calls with live listening capability for G.711 codec. Calls are fetched via manager port 5029 and can be filtered by IP, number, sensor, or Call-ID. Column visibility can be customized and settings persist in the database. Programmatic access is available through two methods: the GUI's listActiveCalls API for centralized monitoring of multiple sensors, and the sniffer's manager API (listcalls command) for direct sensor access.
Keywords: active calls, real-time monitoring, live calls, manager port 5029, call filter, column visibility, custom_config, G.711 listening, listActiveCalls API, programmatic access, automation, manager API, listcalls command
Key Questions:
- How do I view active/live calls in VoIPmonitor?
- Why are active calls not showing in the GUI?
- How do I filter calls by IP address or phone number?
- How do I hide or show columns in the Active Calls view?
- What port is used for fetching live call data?
- How can I programmatically check if a call to a specific phone number is currently active?
- What is the difference between listActiveCalls API and the sniffer's manager API?
- How do I retrieve active calls from all connected sensors?
- How do I query active calls from a single sensor directly?
